Introduction
This guide provides instructions on how to set up a fluorescence scan profile. Note that slides have to be loaded in order to set up a profile (see the "Start up" guide). Please refer to the manual if you need more detailed information.
-
-
Before starting a large imaging job, it is recommended that you do a full reboot of the system, in the case that you find the microscope on
-
Click the shut-down icon on the desktop, which will turn off the PC
-
Make sure the PC is completely off before continuing
-
Turn off the power putton at the micrscope's side
-
Turn off the whole system with the main power button that is on the desk
-
Wait at least 3 minutes- This critical to have the memory fully rebooted and avoid memory issues for all components inside the microscope
-
Turn the main power back on. This will automatically turn on the PC without the need to touch the PC's on button directly
-
Turn on the power putton at the micrscope's side
-
-
-
The "Scan" tab should be selected
-
Verify that the saving location is on the network drive with the letter X:\ . Otherwise click on "Browse" and select "This PC > SlidescannerStorage (X:)" as a storage location
-
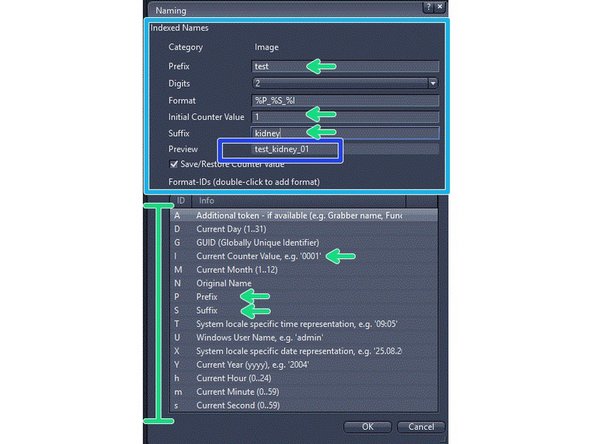
Define the automatic naming of your slides:
-
Select "Edit"
-
Define your naming template in the "Naming" window
-
Below there are the naming codes, which are letter precided by a % sign. You will put the codes together, as in the example %P_%S_%I, which uses a prefix, a suffix and a counter
-
Check the preview to see the final format and adjust as you need
-
The import of slide names and the automatic assignment of scan profiles to individual slides is possible via a comma-separated file (.csv). See corresponding guide.
-
-
-
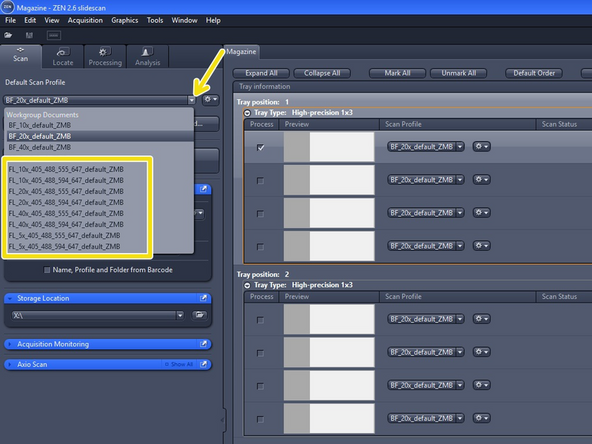
Start with one of the ZMB default profiles (they are already optimized for imaging with a particular objective)
-
Expand the "Default Scan Profiles" menu and select a "FL default ZMB" profile according to the objective you wish to use
-
Be aware that two profiles are available per objective. Select the one that shows the right excitation wavelengths for your fluorochromes (e.g. either with 555 nm or 594 nm)
-
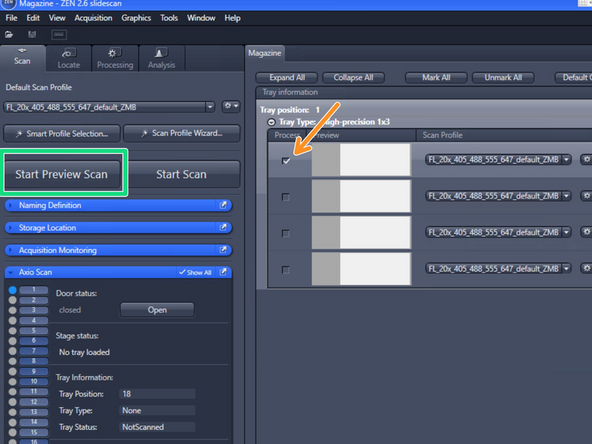
Mark one representative slide of your experiment to adapt the settings of the profile
-
Capture a preview image by clicking on "Start Preview Scan"
-
-
-
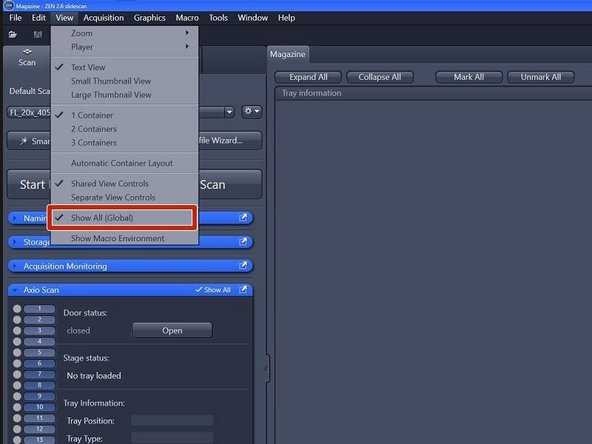
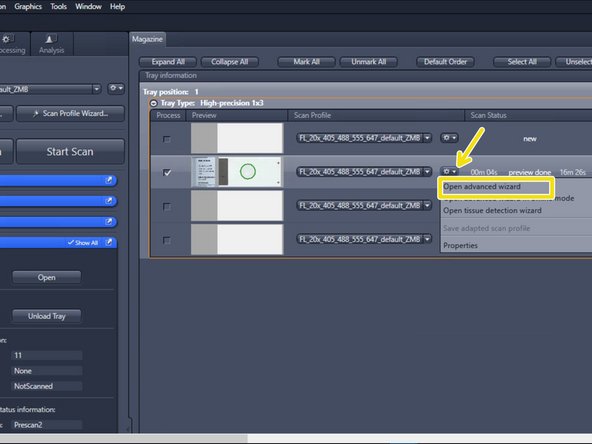
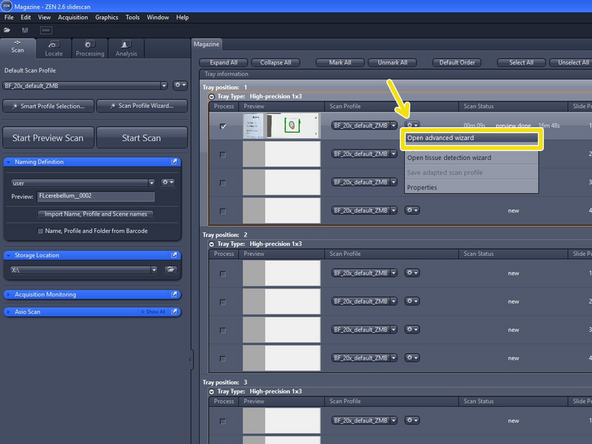
Ensure that "Show All (Global)" is activated under the tab "View"
-
Select "Open advanced wizard" to adjust scan parameters
-
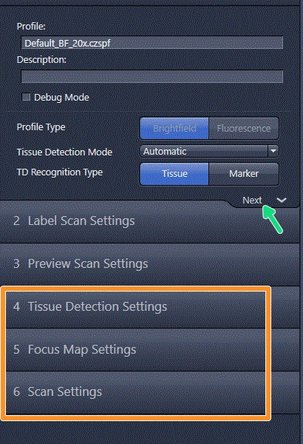
The advanced wizard is composed of 6 steps to adjust scan parameters. Step 1-3 are already optimized for standard slides.
-
How to optimize step 4-6 will be explained in the next steps of the guide
-
At the end of each step click on next to proceed
-
-
-
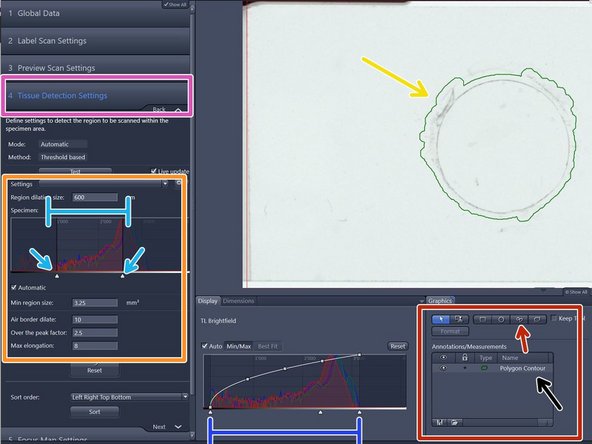
After the preview scan is finished you will be directed to the "Tissue Detection Settings" step.
-
The objects surrounded by a green line are the selected region of interests (ROIs) for scanning
-
They are also listed here
-
Automatic tissue detection is defined on the range shown on the preview histogram and the parameters in the "Tissue Detection Settings" (left) if there is enough contrast in the sample
-
The preview histogram shows the distribution of the intensities of all pixels in the images in RGB. Toggle with the window range of the histogram to adjust the ROIs that are detected
-
It is advisable to play around with the automatic tissues detection, as it will save a lot of time to not have to draw the ROIs manually
-
If you have trouble seeing your sample, you can adjust the contrast on the histogram at the bottom. Note that this just changes how you see the image, and now how the scanner detects the ROIs
-
Manual tissue selection might be necessary for samples with low contrast e.g. fluorescence samples.
-
-
-
Deactivate "Show All" and activate it again in order to see all options for the automatic tissue detection. (This is a software bug)
-
Modify upper and lower threshold of the "Specimen histogram" to select the ROIs according to intensity values
-
If the "Automatic" checkbox is activated the upper threshold will be determined automatically based on the "Over the peak factor" (a measure for the expected contrast between the glass and tissue)
-
Filter out artifacts with the help of following parameters:
-
"Min region size" : defines the minimum area a ROI should have
-
"Air border dilate": defines the expected distance of the object from borders of the preview scan region
-
"Max elongation" can be adjusted to exclude elongated artifacts
-
Define a spacing of the border around the detected tissue by adjusting the "Region dilation size" (normally adjusted between 150-200)
-
-
-
If signals are faint it might be necessary to select the ROIs manually with the help of different drawing tools
-
Adjust the display curve of the histogram for maximal contrast
-
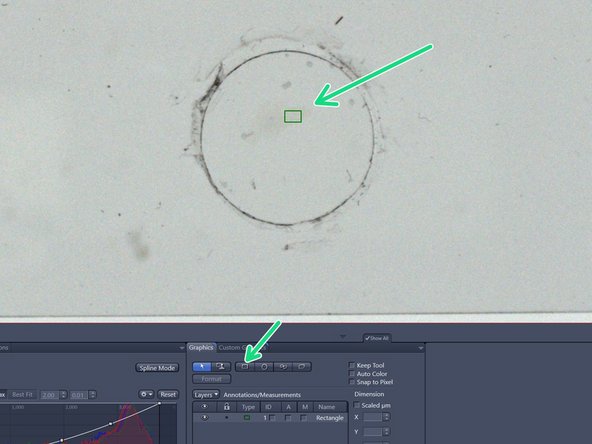
Draw the wanted regions manually with the tools in the "Graphics" tab
-
Draw the outline of the scanning area with the "Draw Spline Contour" tool. You close the ROI with a right click
-
Make sure that there is not too much empty space within your ROI. Empty space is areas where the scanner will not be able to focus, as there will be nothing to focus on
-
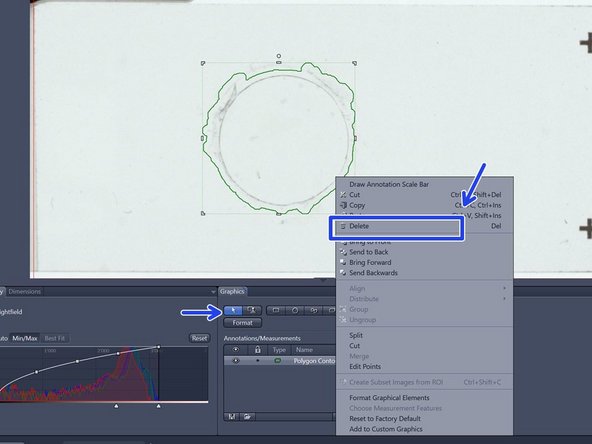
The defined ROIs are listed in the Graphics tab. They can be saved and later be applied to other slides
-
Delete regions that should not be included for scanning: click the selection arrow and left click to select the regions and right click in order to delete
-
Select a small ROI if you want to test new settings
-
-
-
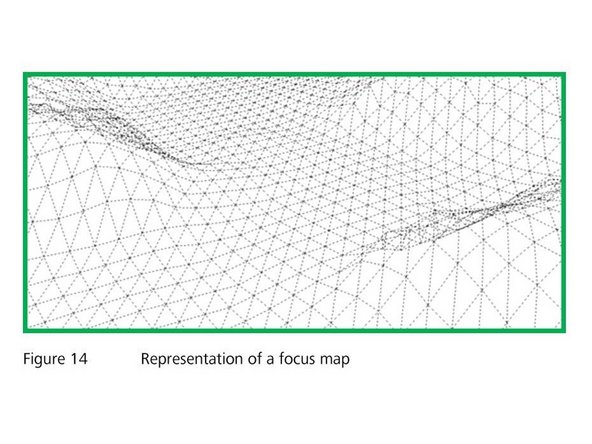
The scanner generates images of your tissues utilizing a "focus map". The focus map is a set of x, y and z coordinates (focus points) that represent the surface of the detected tissue section. While the slide is being scanned, the focus position will change continually following the contour of the focus map.
-
The x & y coordinates of the focus point are defined by a 2D layout of the ROI, and the amount of points will depend on the magnification of the objective. Lower magnifications will have less focus points
-
The z coordinate of the focus points will be done automatically by the scanner. This will be found by the scanner making a series of images at each x-y coordinates, and will compare such images to each other calculating the highest likelihood that each image would be the focus, based on contrast (sharpness)
-
The focus map is created in two steps: In a first step a coarse focus map is created with a low magnifying lens like the 5x objective ("coarse focus"). In a next step the focus map will be refined by a "fine" focus, that is performed with the imaging lens that you have chosen
-
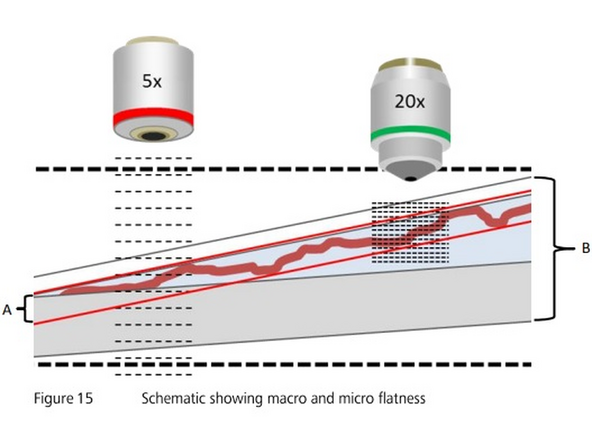
You should pay attention to:
-
The range where the images are made in z, if the range is not correct and does not include the tissue, the scanner wont be able to determine focus, you should also try to keep the focus close to the middle of the range to ensure it works well for other slides.
-
The amount of light being delivered to the sample. The better the illumination, the better the focusing
-
Appropriate focus map settings are important to ensure good focus quality throughout the specimen. Poor set ups can result in bad quality images, or errors and stopping of the acquisition
-
-
-
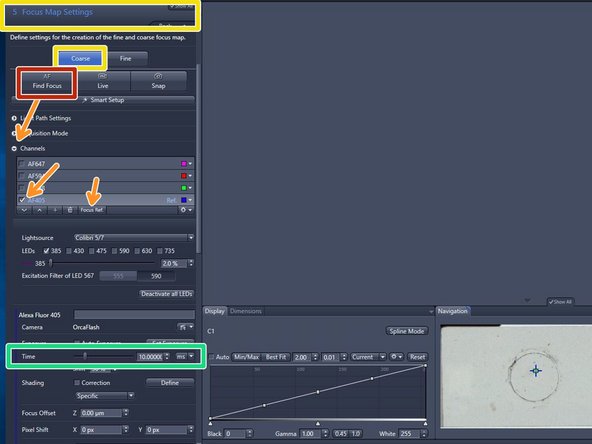
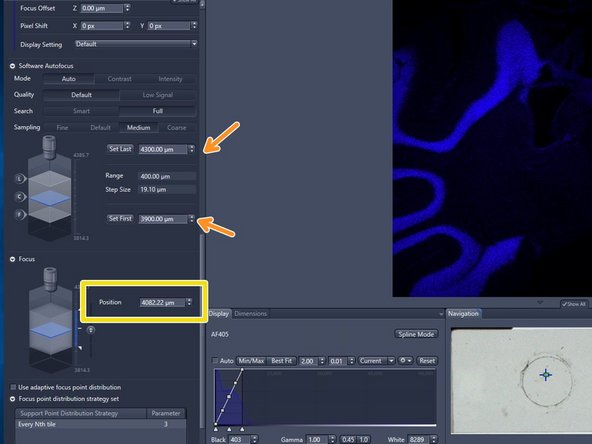
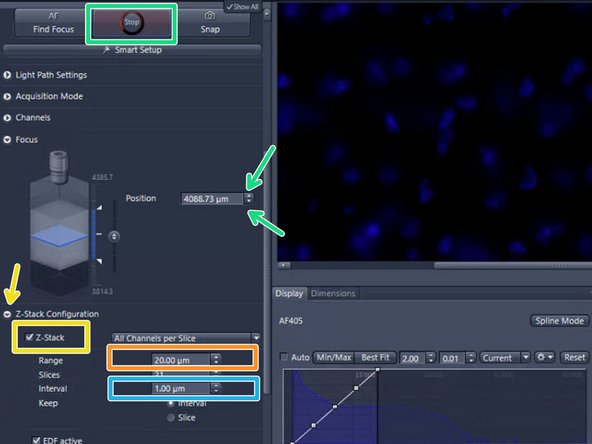
Duble clikc "The Focus Map Settings" tab and make sure "Coarse" mode is active
-
Expand the "Channels" drop down menu and set your nuclear staining channel, or primary channel of interest as reference channel for the autofocus.
-
AF405 (DAPI) is selected by default. The rational is that if the scanner is focusing well on nuclei, then all other structures on other channels will be also in focus
-
Start with the given exposure time e.g. 10 ms for relatively bright samples
-
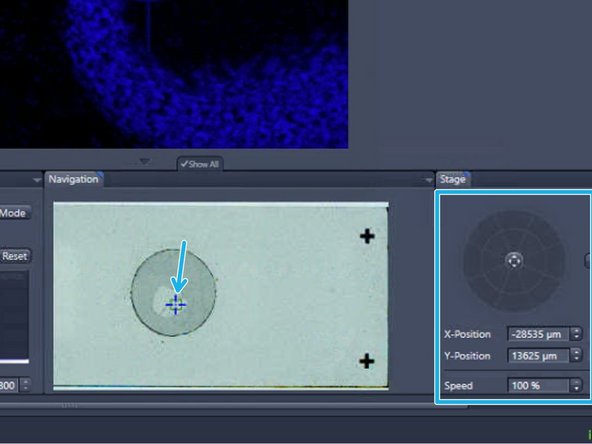
The initial x-y position is per default in the center of the ROI. To move the sample click into the slide view shown in the "Navigation" tab or use the virtual joystick to navigate more precisely
-
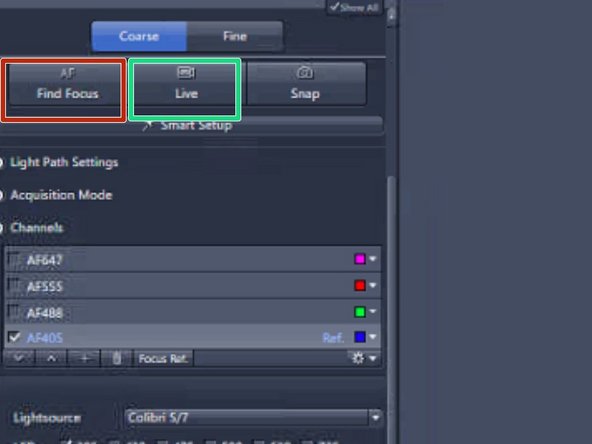
Click on "Find Focus"
-
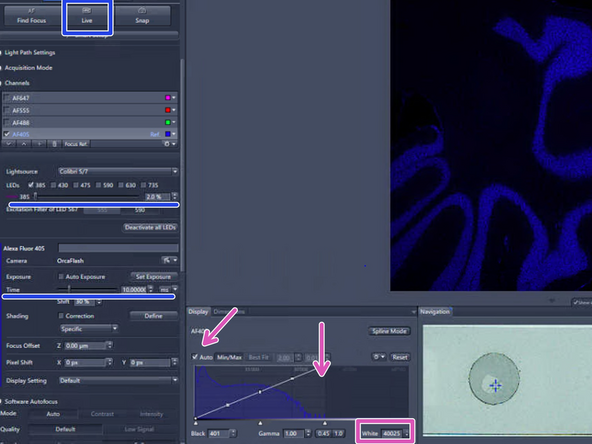
Look at the histogram to determine the appropriate exposure, checking "Auto" above the histogram. Make sure the "tail" of the histogram shows at least 2000 intensity values, but no saturation
-
To reach the sufficient intensity values increase the exposure time, up to 300 ms. You can also increase the intensity of the LED light delivered onto the sample by increasing the power percentage. Click on "LIVE" to see the changes
-
-
-
Move to different locations in the sample to test the "Coarse Focus"
-
If the focus quality is fine at different positions of the sample, move to the next step of the guide
-
If the focus was not determined properly try to search manually for the focal plane:
-
Click on "LIVE" in order to switch on the camera
-
Focus manually: click on the arrows of the "Focus Position" display or click into the number field and move up/down with the mouse wheel
-
Adapt the borders of the capture range so that the focal plane is roughly in the middle. Never make the range greater than 500 microns
-
BEAWARE that the capture range can neither be too far (>100 microns) from the standard values, nor wider than ~500 microns. This because the scanner is a widefield system for standard slides, so it knows where the bottom of the slide is and that this system works best with thin sections.
-
Click on "Find Focus" to test the new autofocus settings
-
-
-
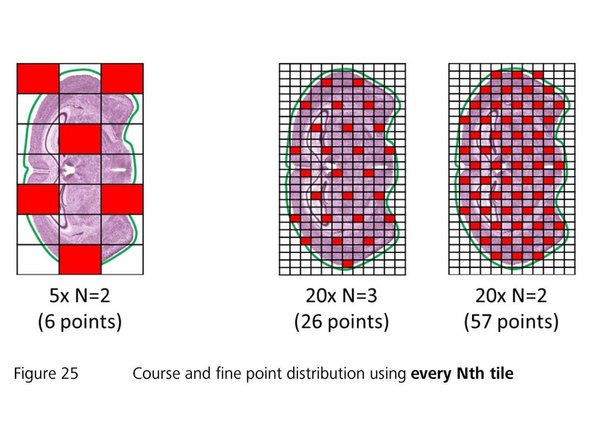
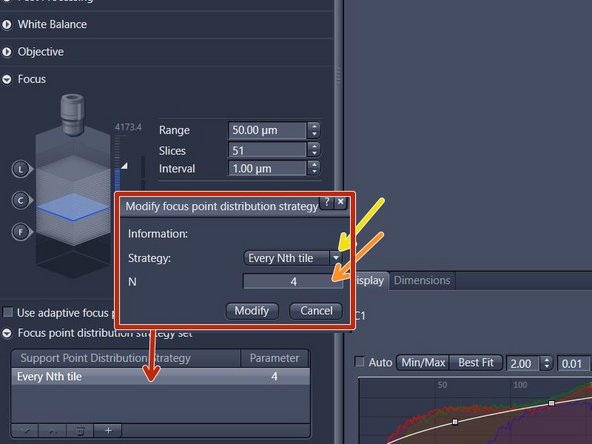
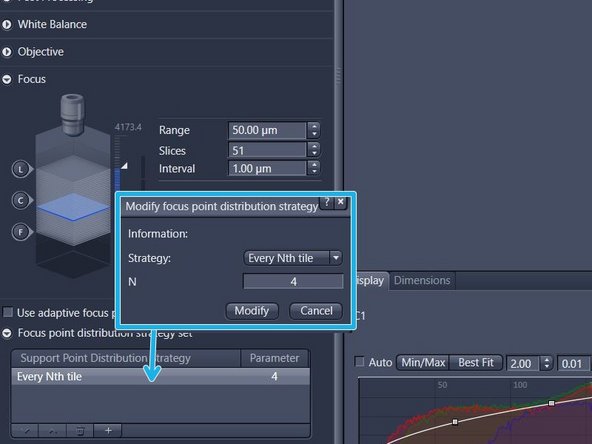
The "Focus Point Distribution Strategy" defines how and how often the autofocus will be executed
-
The default settings work normally fine for standard tissue samples with a medium size
-
For very small, very large or uneven samples, the default settings may have to be adjusted for increased precision or speed:
-
Double-click on the entry of the table view and change parameters in the new window. Click on "Modify" to apply the changes
-
For uneven samples, it might be necessary to increase the number of focus points. Note: for the "Every Nth Tile" strategy the value "N" has to be decreased in this case. Be aware that a higher accuracy of the focus map comes at the cost of a longer scanning time
-
For very small or large tissue sections, selecting another focus strategy might be useful. Change the "Strategy" set via the dropdown menu. Select "Center of Gravity" for very small sections or "Onion Skin" for large specimens
-
The number of focus points should not exceed 400. Restrict the number of focus points for very large specimen by selecting the "Onion Skin"strategy with a maximum of 400 focus points
-
For more information consult the AxioScan Z.1. Application Guide or ask the ZMB staff
-
-
-
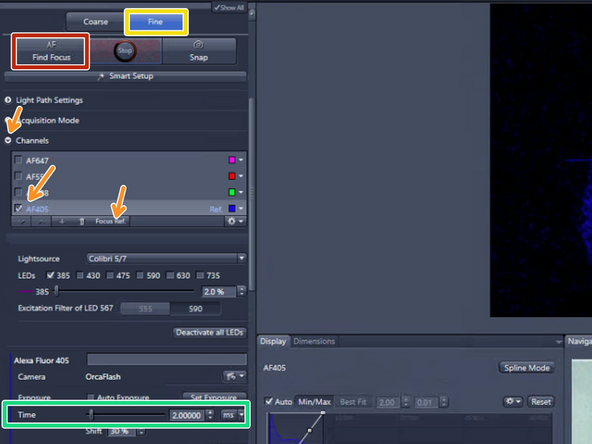
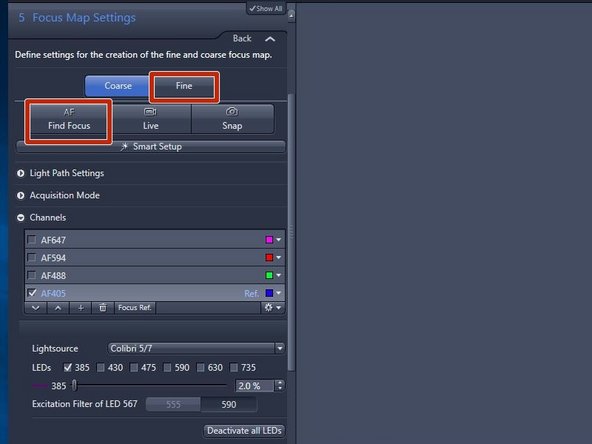
Select "Fine"
-
Expand the "Channels" drop down menu and set the reference channel for the Fine autofocus. Per default AF405 (DAPI) is selected
-
Click on "Find Focus"
-
Start with the given exposure time for relatively bright samples. If the focus us not found, then gently increase the exposure 10 ms at a time, and not beyond 300 ms - also see next step
-
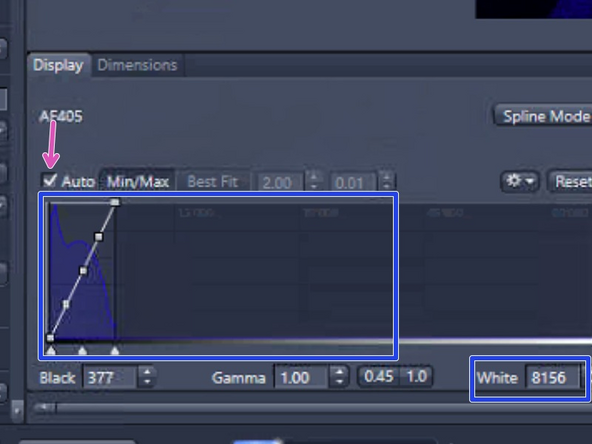
Investigate the histogram to determine the appropriate exposure:
-
Check "Auto" above the histogram
-
Make sure the histogram shows at least 2000 intensity values and no saturation. Adapt the exposure time if necessary, not beyond 400 ms. To increase the light delivered to the sample, you can also increase the power of the LED
-
Define the Focus point distribution as described in the previous step. Note: the default settings are a good starting point
-
-
-
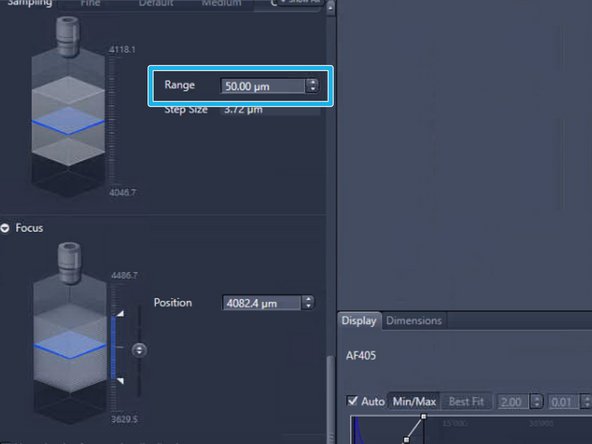
Select "Fine" and press "Find Focus" .
-
If the focus could not be found increase the focus "Range" and try again
-
The maximum fine focus range should not exeed 100 um. If you need to increase the range further, then the coarse focus settings are not well adjusted
-
Note that if you must increase the range beyond 100 um, this means that the coarse focus needs adjustment
-
Test the "Fine Focus" at different locations on the sample
-
The fine focus can only be succesful if the coarse focus was applied before
-
-
-
Double click "Scan Settings"- add picture of this HERE
-
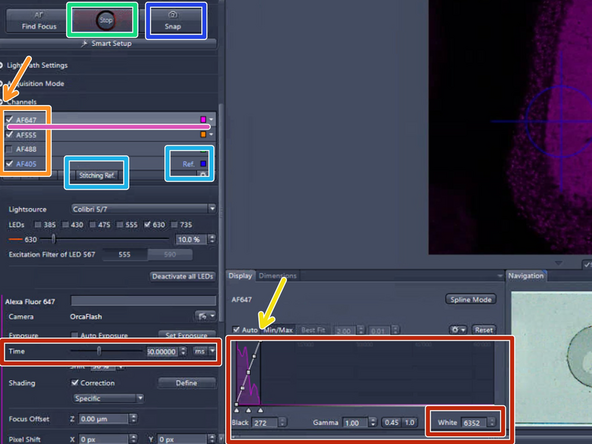
Expand the "Channels" drop down menu and activate the channels you need and set up an appropriate exposure time for each channel:
-
Highlight a channel
-
Click on "Live"
-
Check the "Auto" ticking box and observe the histogram min/max levels
-
Set up the exposure time for each channel making sure you observe at least 5000 intensity values (check histogram)
-
Set the reference channel for stitching: Per default AF405 (DAPI) is selected as reference channel. If another reference channel is needed, highlight the appropriat channel and click on "Stitching Ref." An appropriate stitching channel is one in which the dye covers the specimen evenly
-
Optional: Click on "Snap" to capture a single image with all the channels
-
-
-
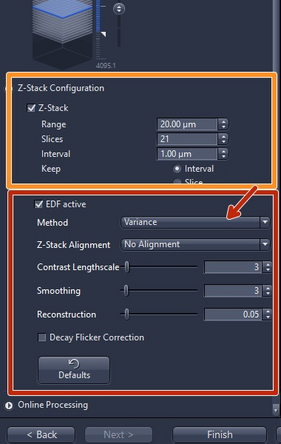
Define a z-stack if the tissue is not flat or very thick. By default the z-stack function is disabled
-
Tick "Z-Stack"
-
Set the "Range"
-
By clicking on the arrows of the "Focus Position" display or into the number field and moving up/down with the mouse wheel you can focus through your specimen in order to determine an appropriate z-range. Make sure that the camera is on "Live"
-
The maximum z-range should be below 300 um for the 5x, 10x and 20x lens and below 50 um for the 40x lens to avoid damage of the objective and / or slide
-
Set the z-interval depending on the imaging objective and desired z-resolution e.g. 5 um for the 5x lens, 2 um for 10x lens, 1 um for 20x lens and 0.5 um for 40x lens
-
Check "EDF active" (Extended depth of focus) if you would like to get a 2D projection of your z-stack. Select either "Variance" or "Maximum intensity projection"
-
We strongly recommend to use the predefined standard parameters for each method
-
-
-
The "Online Processing" expander is the final step of the wizard. For online stitching and imaging with the default format nothing has to be changed
-
"Online" stitching is the default setting and means that the acquired tiles are already stitched during the scan process
-
For large tissue sections >(2cm^2), with multiple channels and z-stacks, offline stitching is recommended
-
"Pyramid active" should always be acitvated as this will speed up the viewing of the images afterwards
-
The files will be saved in the Zeiss file format (.czi). A lossless compression is selected per default. In order to reduce the file size "lossy compression" with a quality of 85% could be selected at the expense of a lower image quality
-
Press "Finish"
-
-
-
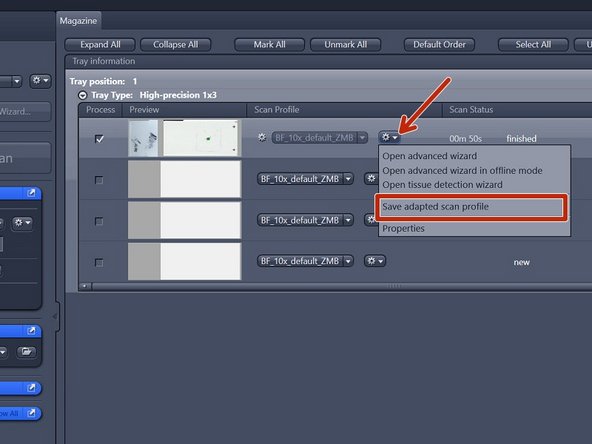
Here is best to first save your settings "Save adapted scan profile", even when you want to make changes, as it is easy to click the incorrect setting and loose your work. Save your profile in the following directory (just copy-paste it):
-
"C:\Users\%username%\Documents\Carl Zeiss\ZEN\Documents\Scan Profiles"
-
The saved profile will be available in your personal "Default Scan Profiles" list and can be applied to other slides
-
-
-
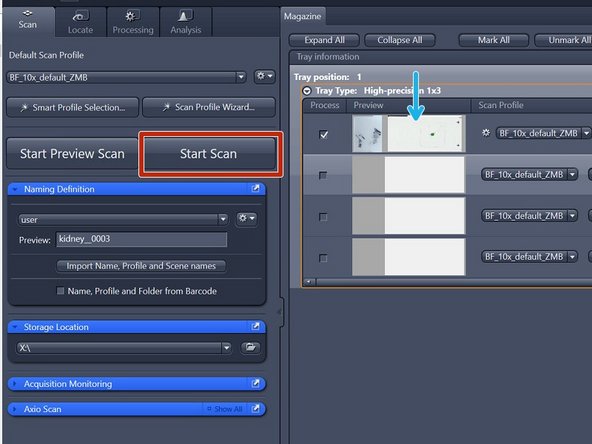
Once all parameters are adjusted, test the adapted scan profile on a small ROI. Note: a small ROI has to be manually defined in the "Tissue Detection Settings" step
-
Press "Start Scan"
-
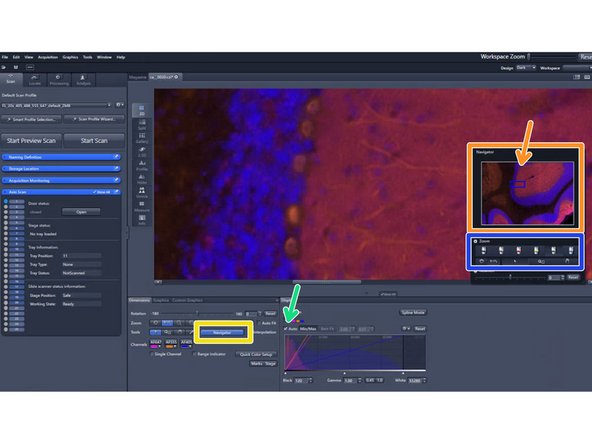
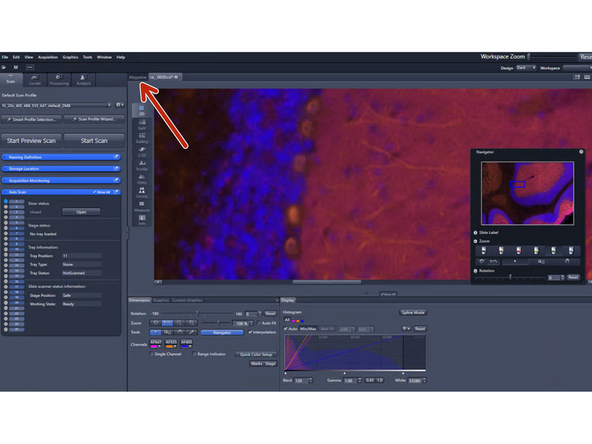
Visualize the resulting image by double-clicking on the slide's preview image after the scan process has been completed
-
Check "Auto" above the histogram to optimize the visualization of the image
-
Click on "Navigator"
-
You can now navigate in the small window by clicking around
-
Select the imaging lens to visualize the data with an appropriate zoom factor
-
Navigation is also possible with the computer mouse: zoom in / out with the mouse wheel and left click on the image and drag it to move around
-
-
-
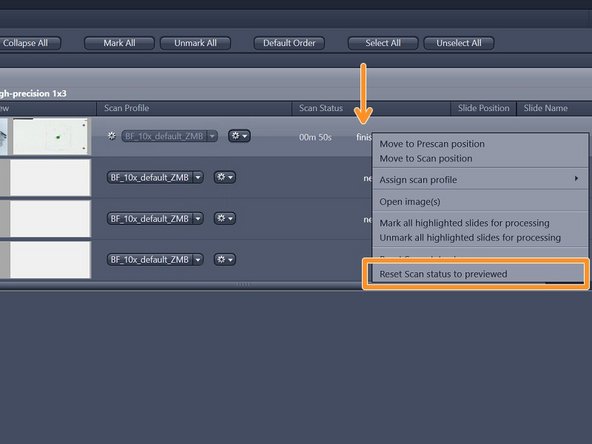
If you are not satisfied with the resulting image go back to the "magazine" to make changes
-
Right-click into the scan status "finished"and select "Reset Scan Status to previewed"
-
Go again to "Open advanced wizard" and adjust the parameters
-
Make sure that when you save the same profile twice, you name it different names, otherwise the software has bugs that corrupt the overwritten scan profiles
-
-
-
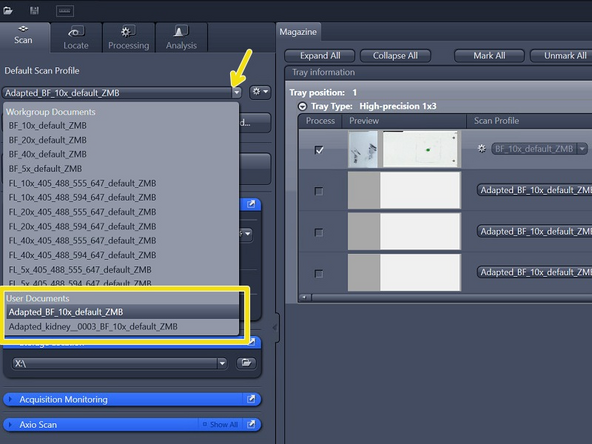
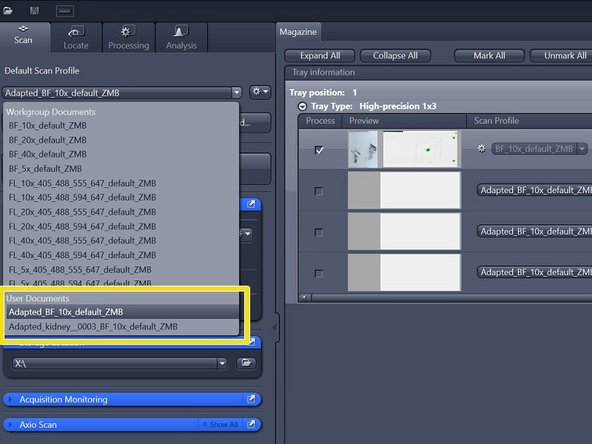
Select your saved profile under "Default Scan Profiles" > "User Documents"
-
The selected profile will be assigned to all slides with the status "new"
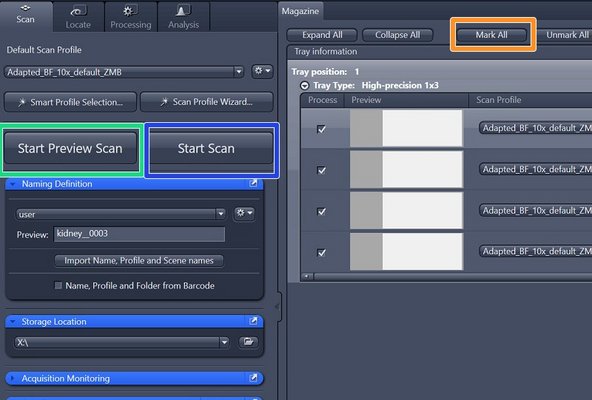
-
Select all the slides that should be imaged: Click on "Mark All" or select the slides manually
-
Click on "Start Preview Scan"
-
After all previews have been captured select "Open tissue detection wizard" and edit the selected ROIs if necessary
-
In order to scan all your slides click on "Start Scan"
-
-
-
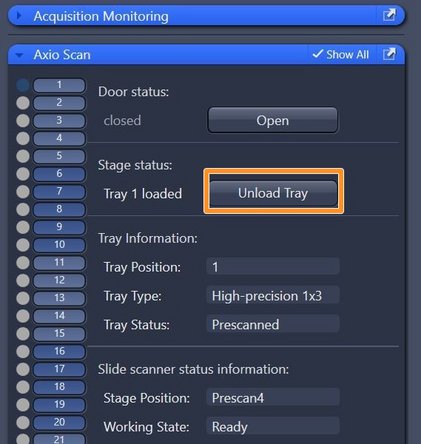
Make sure that all trays are unloaded and take out your slides
-
Close the software
-
Transfer your data via the "Data Mover" available on Citrix. See separate Dozuki guide. The data transfer can be initiated at any computer
-
To visualize alidescanner datasets without prior file conversion to .tif, the software Zen blue, the open source tool QuPath or Imaris can be used. This software tools are available on the ZMB virtual machines
-
To export Zeiss AxioScan .czi files to .tif we recommend to use ZEN blue. See corresponding "Export .czi files to .tif " guide
-