Introduction
This guide provides instructions on how to set up a brightfield scan profile. Note that slides have to be loaded in order to set up a profile (see "Start up" guide). Please refer to the manuals on the ZMB homepage if you need more detailed information.
-
-
Select the "Scan" menu.
-
Verify that the saving location is on the network drive with the letter X:\ . Otherwise click on "Browse" and select " This PC \ SlidescannerStorage (X:)\data" as a storage location.
-
Define the automatic naming of your slides:
-
Select "New".
-
Define a name for your naming template and save it.
-
Define your files name in the "Naming" window.
-
The import of slide names and the automatic assignment of scan profiles to individual slides is possible via a comma-separated file (.csv). See corresponding guide.
-
-
-
In "Default Scan Profile" select a "BF_default_ZMB" scan profile according to the objective you wish to use.
-
Check a representative slide of your experiment to test the profile.
-
Capture a preview image by clicking on "Start Preview Scan".
-
-
-
Ensure that "Show All (Global)" is checked in the "View" tab.
-
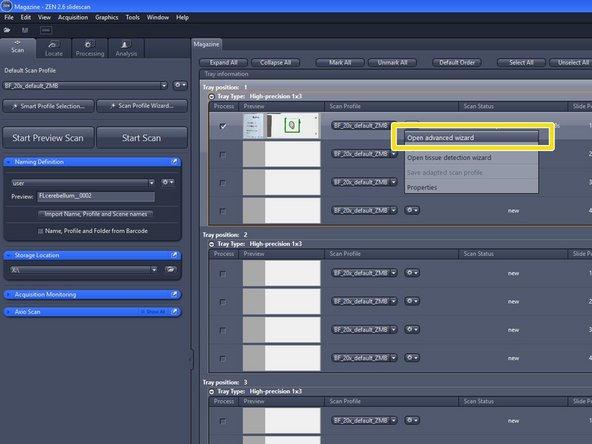
Select "Open advanced wizard" to access the wizard and to adjust scan parameters.
-
The advanced wizard is composed of 6 steps to adjust scan parameters. Step 1-3 are already optimized for standard slides.
-
How to optimize step 4-6 will be explained in the next steps of this guide.
-
-
-
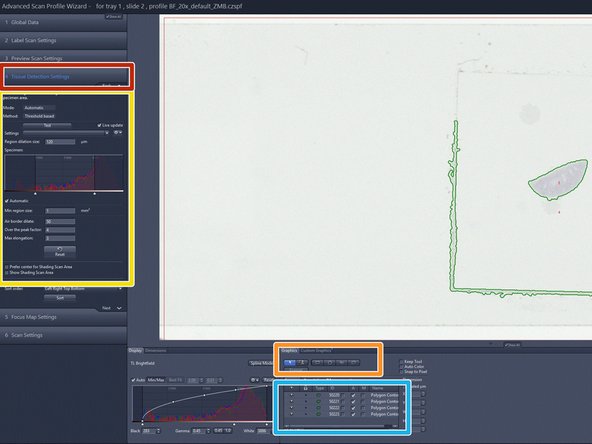
After the preview scan is finished you will be directed to the "Tissue Detection Settings" step.
-
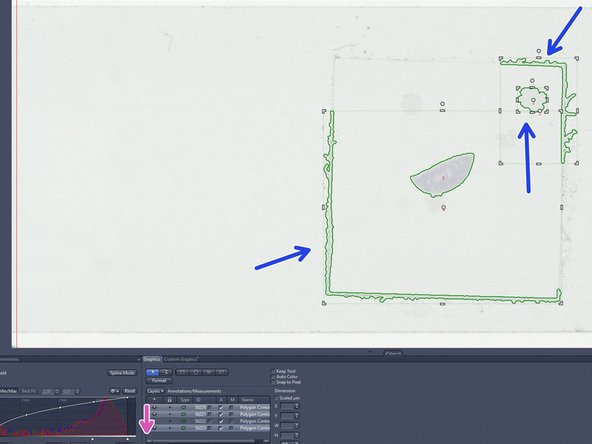
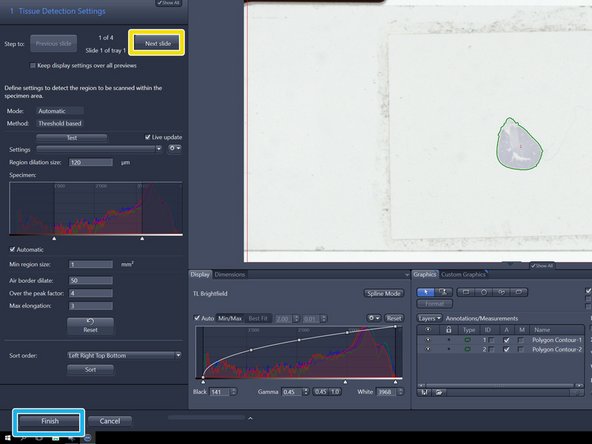
Objects surrounded by a green line are detected ROIs (region of interests) for scanning.
-
The automated ROI selection can be optimized based on the preview histogram and the parameters in the "Tissue Detection Settings" dialog window.
-
For faint signals the ROIs might need to be selected manually with the help of the drawing tools.
-
List of all ROIs.
-
-
-
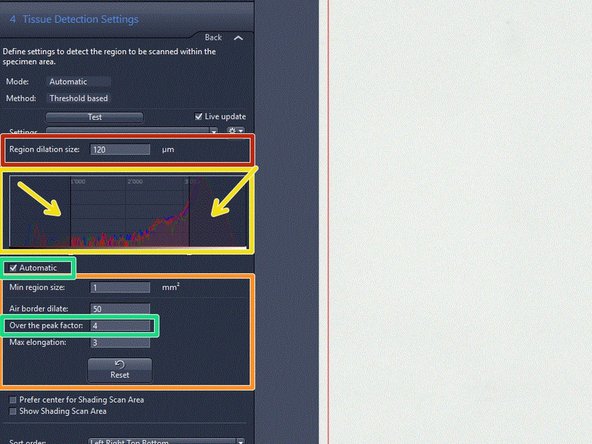
If necessary, change upper and lower intensity thresholds in the histogram in order to optimize the tissue detection.
-
If the "Automatic" checkbox is activated the upper threshold will be determined automatically based on the "Over the peak factor". This parameter is a measure for the contrast between the glass and tissue. Note: the higher the selected value the higher the expected difference in contrast.
-
Additional tissue detection parameters can be defined to reduce the probability of wrong selections:
-
" Min region size" : defines the minimum area a ROI should have. Note: The system will not detect regions that are smaller than this value.
-
"Air border dilate": this is a measure to ensure that slide and coverslip edges are not detected as ROIs to be scanned.
-
"Max elongation" can be adjusted to exclude elongated artifacts. Note: Structures that exeed this value for the ratio between the longest side and the shortest side will be excluded.
-
"Region dilation size" defines a spacing of the border around the detected tissue. Values are set normally between 150 and 200 um.
-
-
-
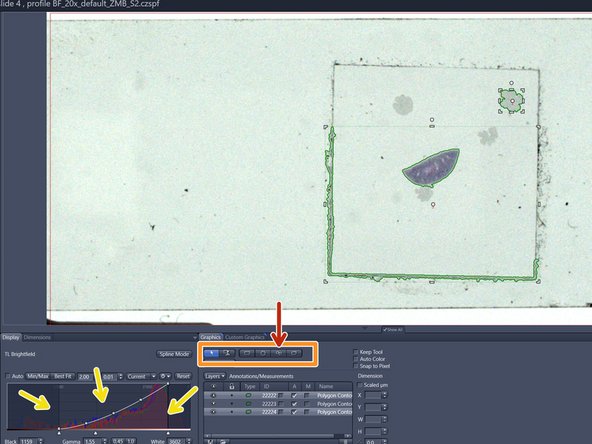
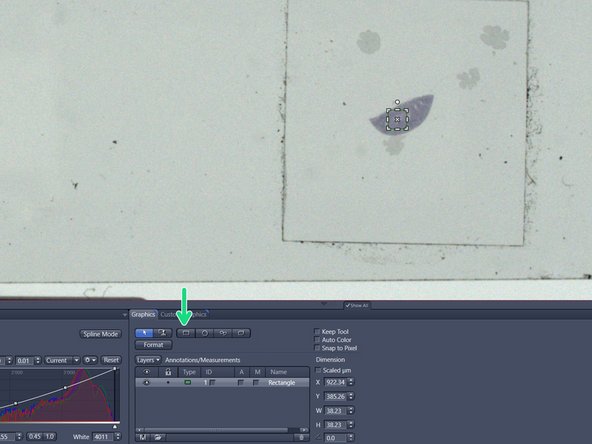
If signals are faint it might be necessary to select the ROIs manually with the help of different drawing tools.
-
Adjust the display curve of the histogram for maximal contrast.
-
Draw the wanted regions manually with the tools in the "Graphics" tab.
-
Tip: Draw the outline of the scanning area with the "Draw Spline Contour" tool.
-
Make sure that there is not too much empty space within your ROI since this could lead to focusing issues.
-
Delete regions that should not be included for scanning: left click to select the regions and right click in order to delete.
-
Optional: Save your ROIs and apply them to similar slides.
-
Select a small ROI if you want to test new settings.
-
-
-
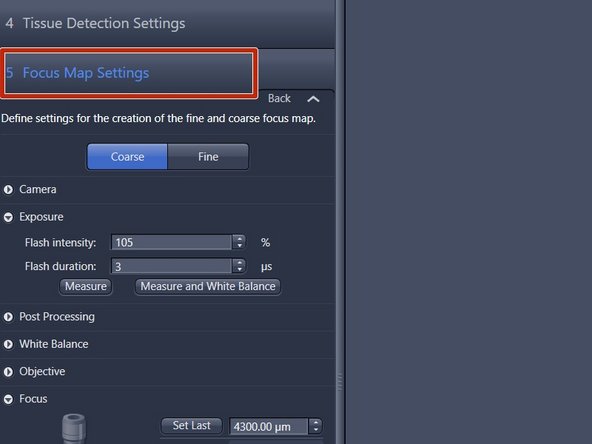
Double click on the "Focus Map Settings" tab.
-
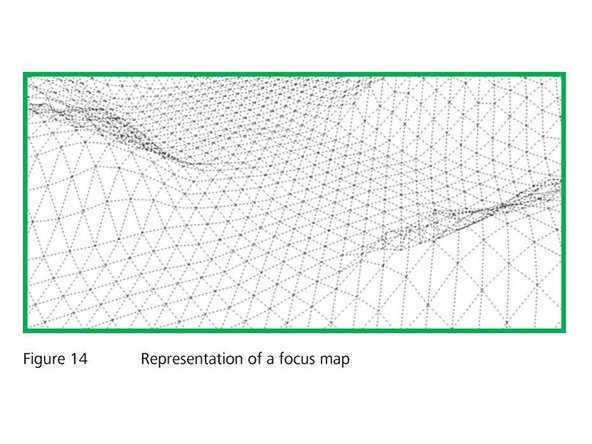
The focus at each position of the sample will be determined automatically based on a focus map that is generated in two steps. First, a coarse focus map will be created with the 5x objective. In the next step, the focus map will be refined by a fine focus that is performed with the imaging lens.
-
-
-
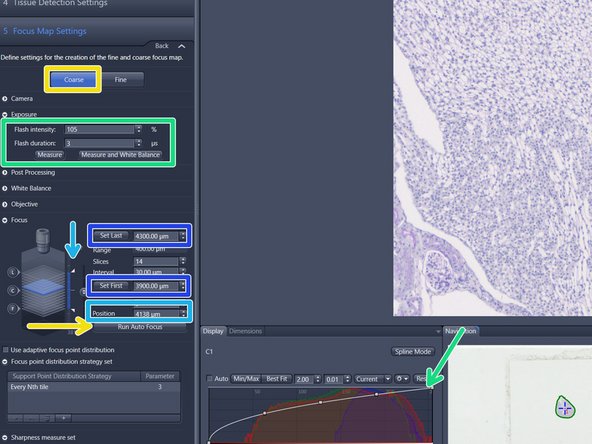
Select "Coarse" and press "Run Auto Focus".
-
Investigate the focus quality of the resulting image.
-
Check the current z-position in the "Position" field. This z-position should be within the range between the values for "Set first" and "Set Last".
-
If the focus is not optimal, focus manually and reset those boundaries:
-
Click into the "Position" field and move up/down with the mouse wheel or click on the arrows of the "Focus Position" display.
-
Adjust the limits of the capture range so that the focal plane is approximately in the center.
-
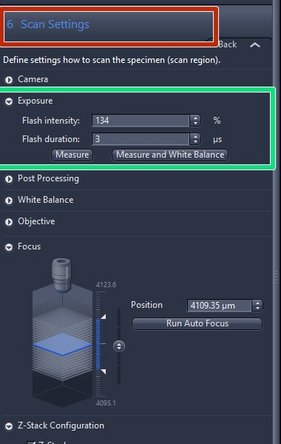
The default "Exposure" settings are normally fine. For very bright or dark signals e.g. if the histogram is clipped, it might be necessary to carefully adjust the "Flash intensity" .
-
-
-
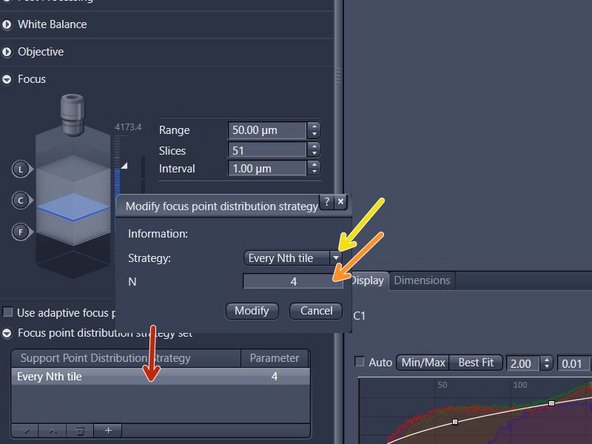
The "Focus Point Distribution Strategy" defines how and how often the autofocus will be executed.
-
The default settings work normally fine for medium size standard tissue samples.
-
For very small, very large or uneven samples, the default settings may have to be adjusted for increased precision or speed:
-
Double-click on the "Focus point distribution strategy" field. Parameters can then be changed in the pup-up window. Click on "Modify" to save the changes.
-
For uneven samples, it might be necessary to increase the number of focus points "N". Note: a larger "N" increases the accuracy of the focus map at the cost of a longer scanning time.
-
For very large or small tissue sections, selecting another focus strategy might be useful. Change the "Strategy" set via the dropdown menu. Tipp: Select "Center of Gravity" for very small sections or "Onion Skin" for large specimens.
-
The number of focus points should not exceed 400. Restrict the number of focus points by selecting the "Onion Skin"strategy with a maximum of 400 focus points.
-
For more information consult the AxioScan Z.1. Application Guide or ask the ZMB staff.
-
-
-
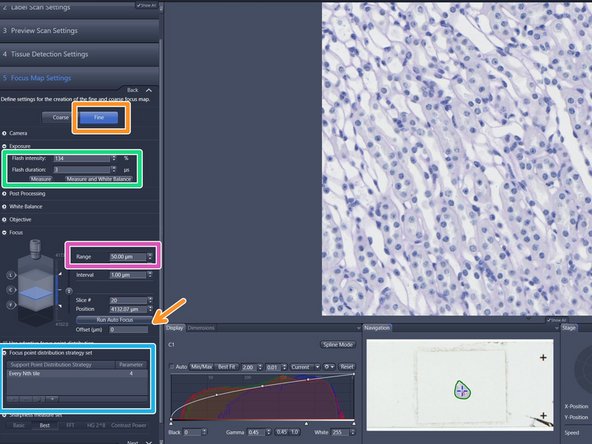
Select "Fine" and press "Run Auto Focus".
-
If the focus could not be found increase the focus "Range" and try again.
-
The maximum fine focus range should not exeed 100 um.
-
The default "Exposure" settings are normally fine. For very bright or dark signals e.g. if the histogram is clipped, it might be necessary to change the "Flash intensity" .
-
Define the "Focus map distribution strategy" as described in the previous step.
-
The default settings work normally fine for standard tissue specimens with a medium size.
-
-
-
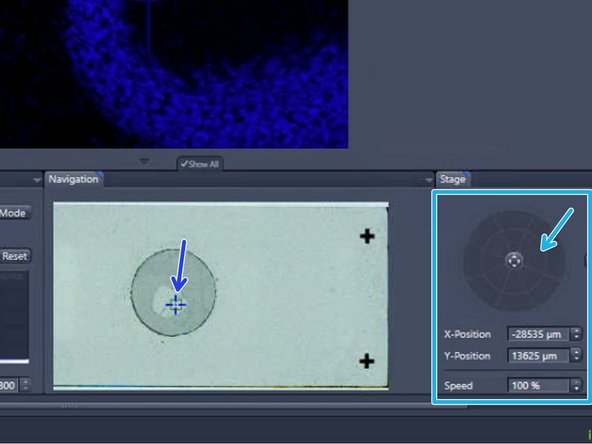
Navigate to diffent positions of your sample:
-
Click inside the slide shown in the "Navigation" tab to move the specimen.
-
You can also use the virtual joystick in the "Stage" tab to navigate more precisely.
-
Test the "Coarse" and "Fine" focus settings as described previously.
-
-
-
Double click on "Scan Settings"
-
For standard slides (thin tissue sections with a medium brightness) it is usually not necessary to change the default scan settings.
-
The value for "Flash intensity" can be changed for very bright or dark signals e.g. if the histogram is clipped.
-
-
-
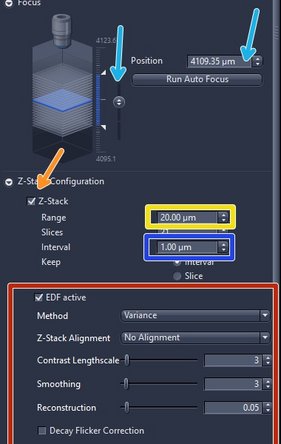
Define a z-stack if the tissue is not flat or very thick. By default the z-stack function is disabled.
-
Check "Z-Stack"
-
Set the "Range"
-
Define the z-range by adjusting the upper and the lower limits of the tissue section. To focus manually click on the arrows of the "Focus Position" display or click into the number field and move up/down with the mouse wheel.
-
Define an appropriate z-interval.
-
Set the z-interval depending on the imaging objective and desired z-resolution e.g. 5 um for the 5x lens, 2 um for 10x lens, 1 um for 20x lens and 0.5 um for 40x lens.
-
Check "EDF active" (Extended depth of focus) if you would like to get a 2D projection of your z-stack. As "Method" select either "Variance" or "Maximum intensity projection" . We strongly recommend to use the predefined standard parameters for each method.
-
The software will combine the regions of strongest contrast within a given z-stack into one image.
-
-
-
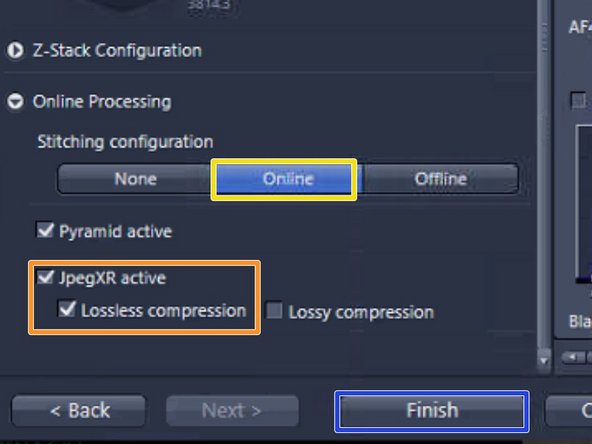
The "Online Processing" expander is the final step of the wizard. For online stitching and imaging with the default format nothing has to be changed here.
-
"Online" stitching is the default setting and means that the acquired tiles are already stitched during the scan process.
-
The files will be saved in the Zeiss file format (.czi). A lossless compression is selected per default. In order to reduce the file size "lossy compression" with a quality of 85% could be selected at the expense of a lower image quality.
-
Press "Finish".
-
-
-
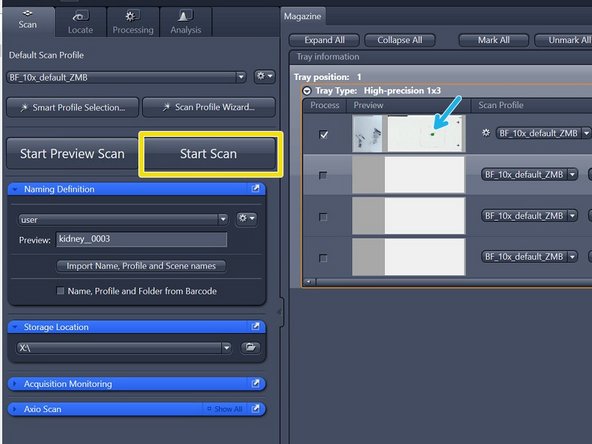
Once all parameters are adjusted test the adapted scan profile on a small ROI of a representative sample. Note: a small ROI has to be manually defined in the "Tissue Detection Settings" step.
-
Press "Start Scan" .
-
Visualize the resulting image by double-clicking on the slide's preview image after the scan process has been completed.
-
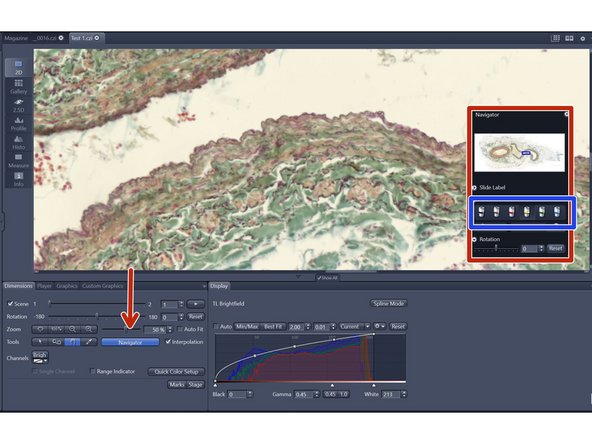
Investigate your image
-
For easier navigation the "Navigator" can be activated.
-
Select the imaging lens to visualize the data with an appropriate zoom factor.
-
-
-
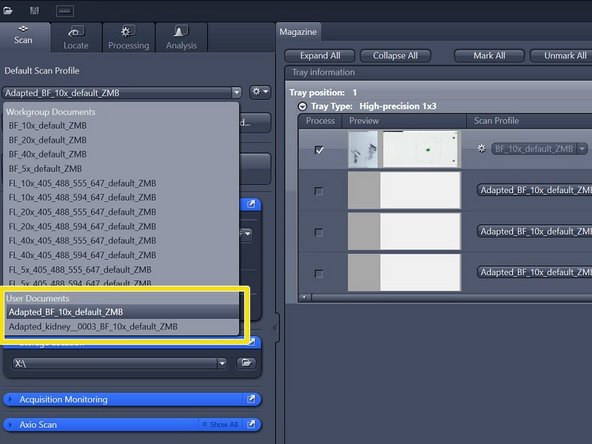
If you are happy with the scan result, select "Save adapted scan profile" and save your profile under:
-
""C:\Users\%userprofile%\Documents\Carl Zeiss\ZEN\Documents\Scan Profiles\""
-
The saved profile will now be available in your personal "Default Scan Profiles" list and can be applied to other slides.
-
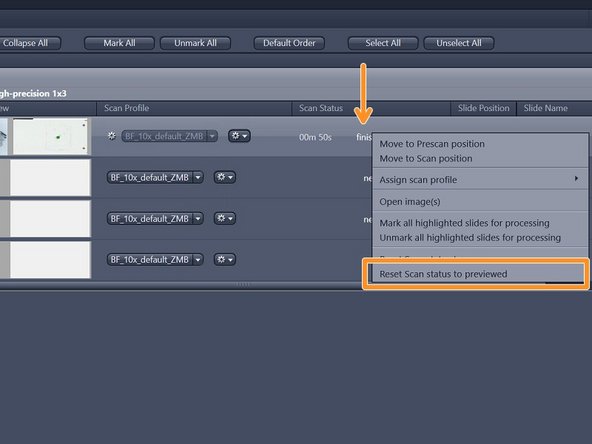
If you are not satisfied with the resulting image, right-click into the scan status "finished"and select "Reset Scan Status to previewed"
-
Go again to "Open advanced wizard" and adjust the parameters.
-
-
-
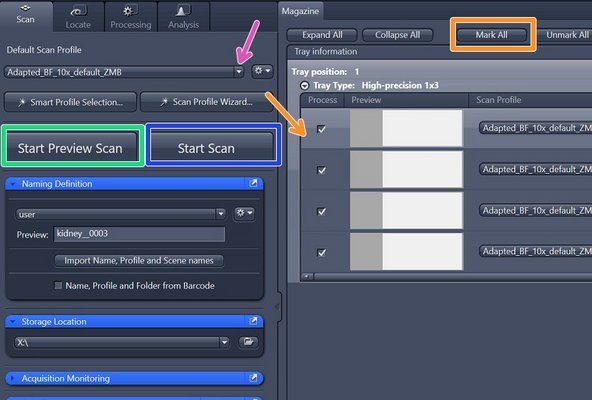
Select the slides to be scanned. To select all slides click on "Mark All".
-
Select your saved profile in the "Default Scan Profiles" list under "User Documents". The profile will automatically be assigned to all slides that have the "Scan Status" new.
-
Click on "Start Preview Scan".
-
After all previews have been captured select "Open tissue detection wizard" and edit the selected ROIs if necessary.
-
Press "Next slide" to move from slide to slide.
-
Press "Finish" when you are done with the last slide.
-
Initiate the scanning of all slides by pressing "Start Scan".
-
-
-
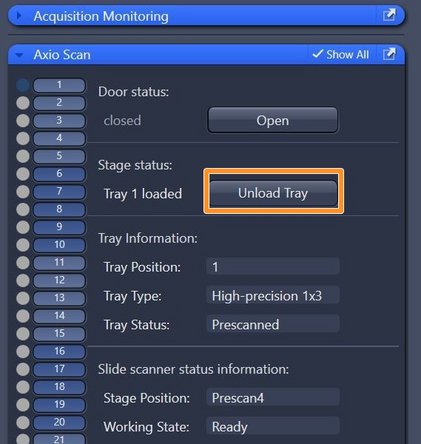
Make sure that all trays are unloaded and take out your slides.
-
Close the software.
-
After the software has been closed, you have to initiate the transfer of your data following this guide.
-
If no other user booked the system after you for that day, switch off the whole system according to the "Shut down" guide . Otherwise just log off.
-
To visualize the resulting datasets without prior file conversion to .tif, , the software Zen blue, the open source tool QuPath or Imaris can be used. This software tools are available on the ZMB virtual machines.
-
To export Zeiss AxioScan .czi files to .tif we recommend to use ZEN blue. See corresponding "Export .czi files to .tif " guide.
-