Introduction
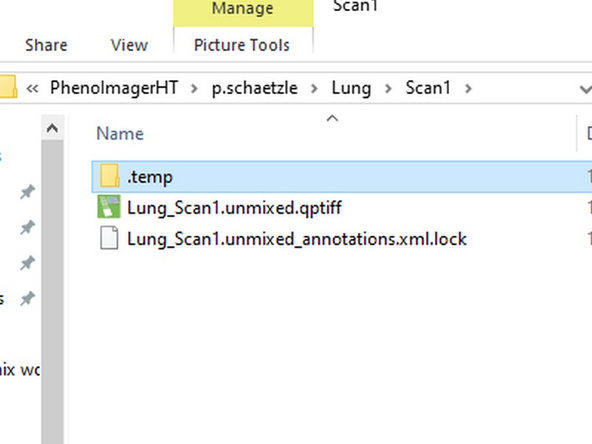
The workflow demonstrates the steps to apply unmixing and autofluorescence removal during acquisition. Beside the original data (located in the ".temp" folder) there will be an additional qptiff file containing the preprocessed images.
However, it seems like this workflow can be only applied to fluorescent panels of DAPI+Opal dyes. Further note that this will increase the required file size for the experiment.
-
-
You will require a fully stained + an unstained control (no DAPI!) sample.
-
Select "Edit Protocol" from main menu and load/define a new imaging protocol. Next, select "Scan Exposures" and click on "Load Carrier".
-
Navigate to your fully stained sample slide. Set the exposure as usual and avoid overexposure by optimizing exposure times.
-
Select a region that contains all markers and take a snapshot by clicking on "Snap". The machine will take an image of all markers.
-
Navigate to your unstained sample and find a region with high autofluorescence. Adapt file name and take another snapshot image.
-
Finally click the "Back" button, return to the main menu and start the Phenochart software.
-
-
-
Click on "Load Slide" (top left).
-
Navigate within your storage folder to the "Snapshots" and select the fully stained recording. Finally click on the "Load" button (top right).
-
Click on "Login" (top right) and type in any shortcut you like.
-
Click on "Stamp" (top center) and select for "InForm Projects"
-
A red box will appear within the image and you need to left click it once inside the image.
-
Load the unstained image by clicking on "Load Slide" (top left) and repeat the last four steps on this image.
-
-
-
Start the InForm software (desktop link). Click on File/Open/Image and select the two previous recordings from the Snapshot folder
-
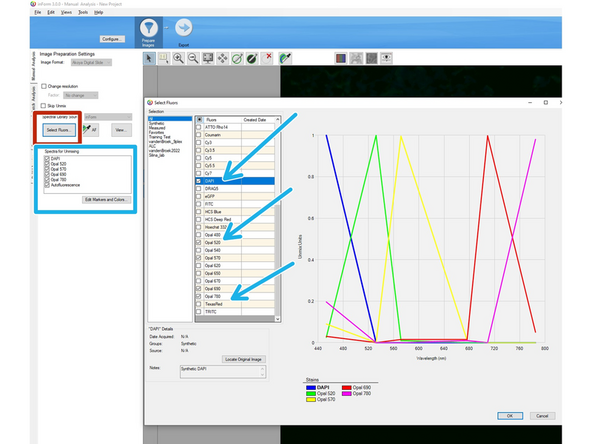
Click on "Select Fluors"
-
A new window will pop up. Select all dye names in the list that you have in your panel except for the autofluorescence. Confirm by clicking OK (bottom right)
-
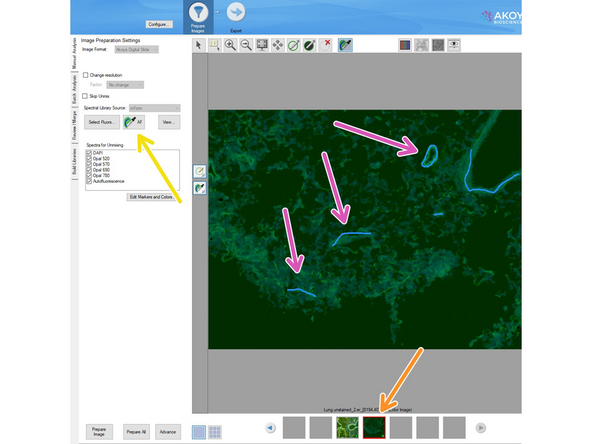
Select the unstained image
-
Click on the AF button
-
Press the "Ctrl" button on the keyboard and mark autofluorescent regions within the unstained image
-
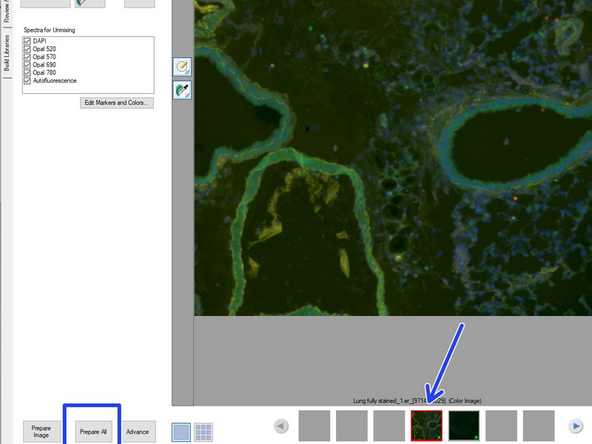
Select the fully stained image and press "Prepare all" button (bottom left).
-
-
-
After calculation the software will display the unmixed image based on the "synthetic dye library" of InForm. You should notice a clear reduction in background signal.
-
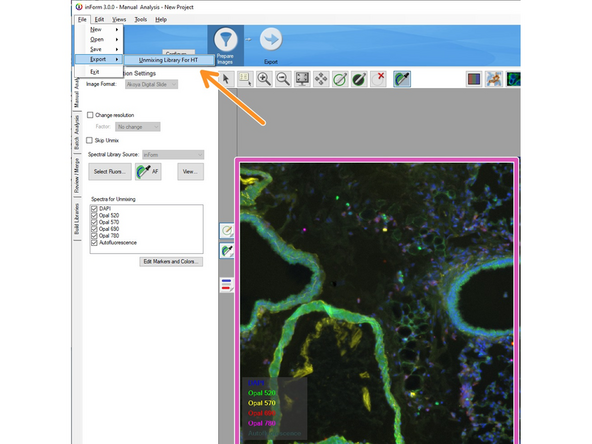
Click on File/Export + Unmixing Library for HT. Define the storage location for later usage.
-
-
-
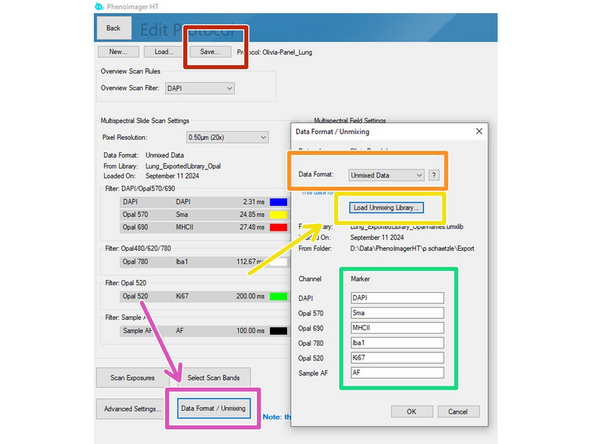
Select "Edit Protocol" and load the protocol you generated before.
-
Click on "Data Format / Unmixing
-
Under "Data Format" select Unmixed Data
-
Select file location of the "Unmixing Library for HT" file you exported in the previous step.
-
Add the marker names corresponding to the dyes (the fields cannot stay blank, so you will need to add anything here).
-
Make sure you finally press the "Save" button
-
-
-
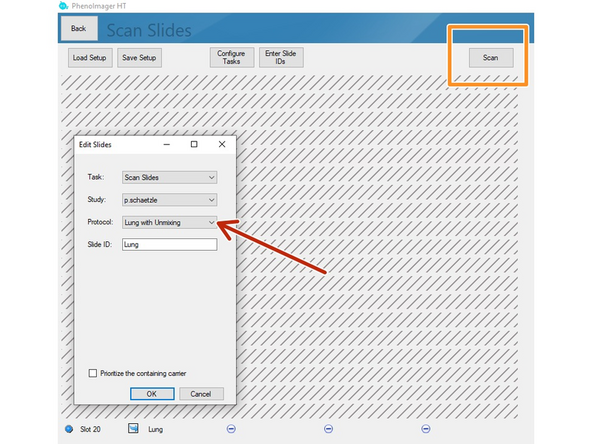
Select the protocol including the unmixing option
-
Scan slides as usual
-
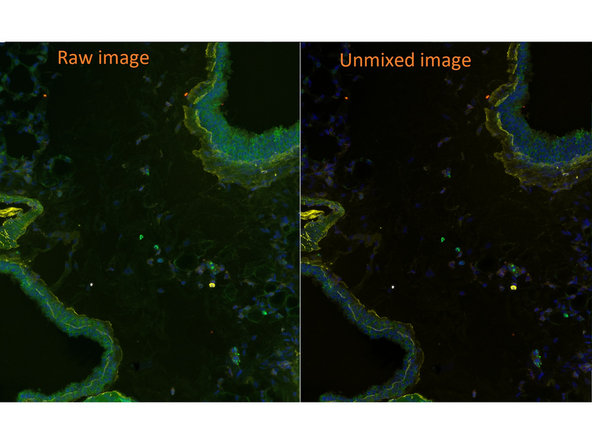
The data folder will contain a qptiff file with unmixed data. Within the temp folder you will have an additional qptiff file with the raw data that is useful to compare the impact of the unmixing procedure.
-
Example of raw vs. unmixed image of the same region
-
Cancel: I did not complete this guide.
One other person completed this guide.


