Introduction
This guide describes how to use the open source tool QuPath to:
- visualize ,
- manually annotate regions,
- navigated around images,
- detectc cells,
- view measurements,
- export results and snapshots
of whole slide imaging data generated by the Zeiss AxioScanner.Z1 slidescanner at the Center for Microscopy and Image Analysis of the University of Zurich.
QuPath was originally created at the Center for Cancer Research & Cell Biology at Queen’s University Belfast and now is further developed at the University of Edinburgh.
If you use QuPath in your research, please include a citation to the original work:
Bankhead, P. et al. (2017). QuPath: Open source software for digital pathology image analysis. Scientific Reports. https://doi.org/10.1038/s41598-017-17204...
For more detailed information and how-tos please check out the github project page:
https://github.com/qupath/qupath/wiki
More documentation here:
https://qupath.readthedocs.io/en/latest/
You will also find many valuable tutorials that will help you further analyse your data using QuPath, e.g.:
- Measuring areas,
- Cell classification,
- Pixel classification,
https://qupath.readthedocs.io/en/latest/...
among many others!
-
-
Book and open a ZMB Virtual Machine.
-
Launch QuPath (Start Menu).
-
-
-
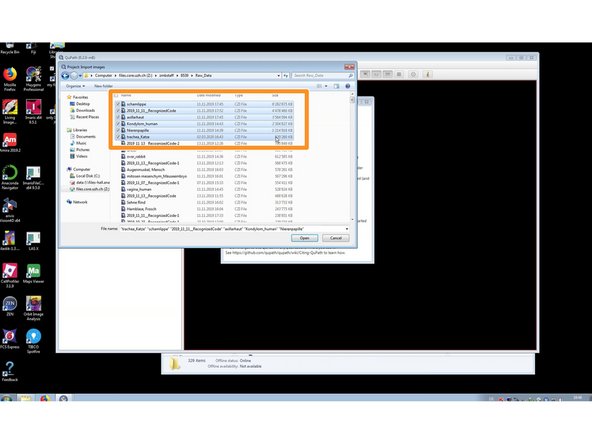
Create a new project. You can now either:
-
simply Drag&Drop your files into QuPath for a quick visualization of a few files,
-
or add them, through the "Add images" button (eg. when you need to add multiple files).
-
In the latter case select "Auto generate pyramids" for a smoother visualization of large images.
-
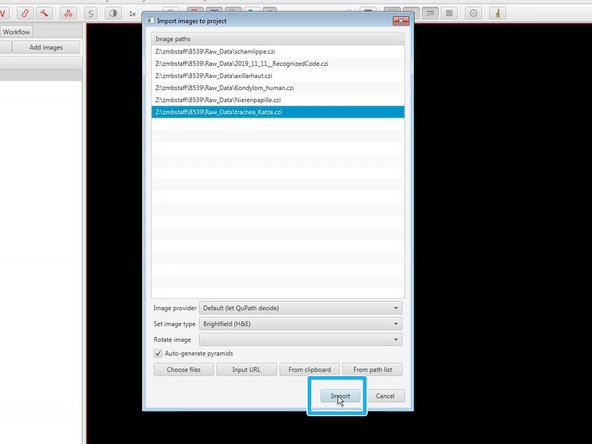
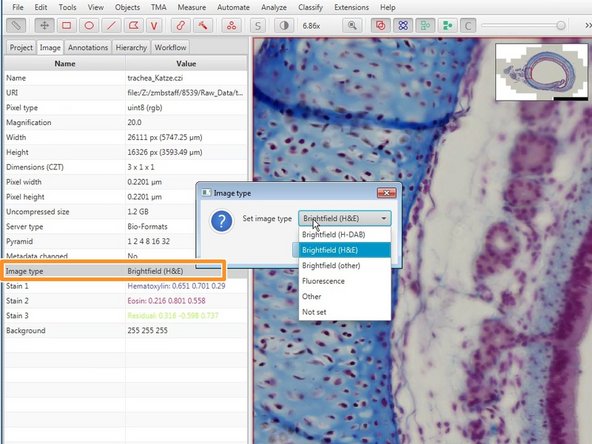
Set the image type. This will affect the availability of processing operations in later steps (eg cell detection, available LUTs).
-
QuPath projects only store the image file paths, but do not copy the actual files. Keep this in mind if you move the original image files.
-
-
-
If you've added your images through the "Add images" button:
-
Select images.
-
"Import" them.
-
-
-
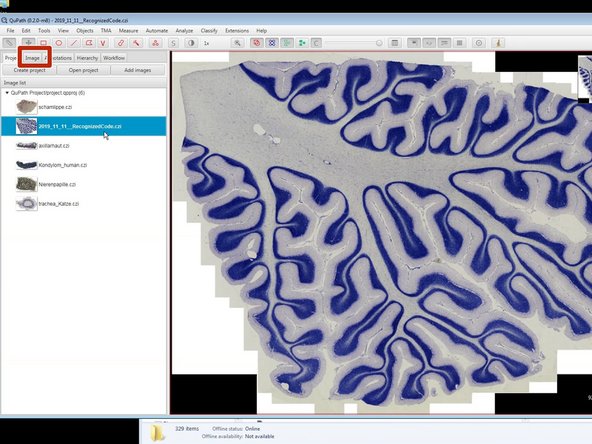
You can now navigate your images using the mouse.
-
the mouse wheel to zoom in and out.
-
click on the image (left click) and drag it to move around.
-
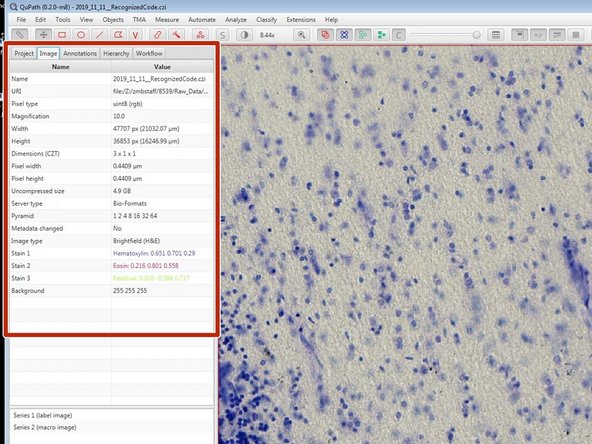
Image properties can be found in the "Image" window.
-
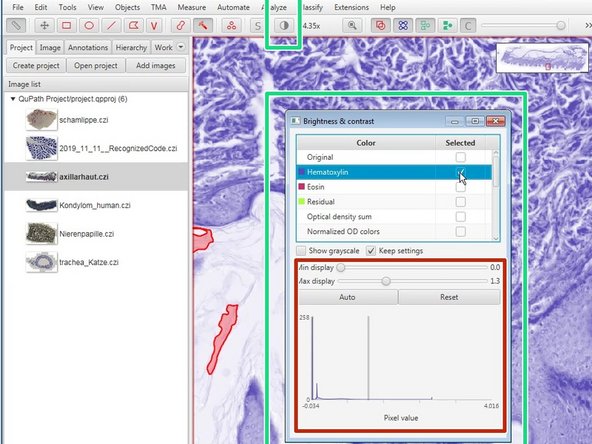
In H&E images you can adjust the visualization using number keys:
-
1-(RGB) 2-(Hematoxylin) and 3-(Eosin)
-
4-9 applies different LUTs to the image.
-
-
-
Different LUTs are applied depending on the set image type. This also affects further processing steps. Make sure your image type is correctly set.
-
To change the image type, double click on "Image Type" in the "Image" window and choose the correct option from the menu.
-
-
-
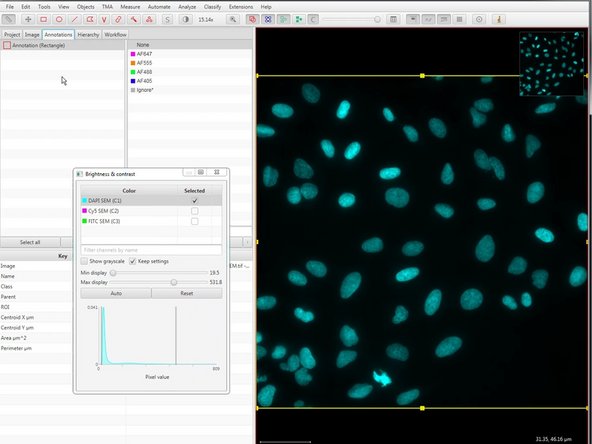
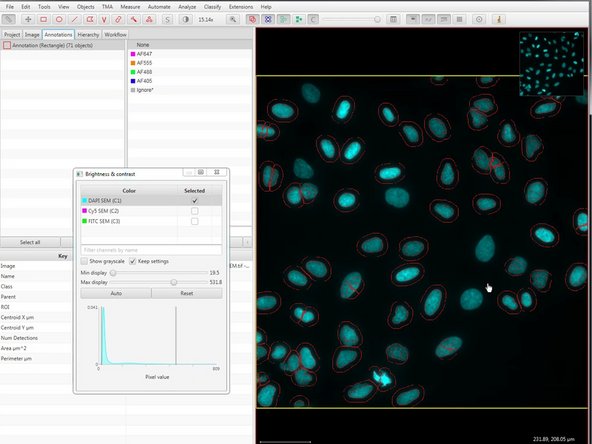
Color transforms can be accessed through the "Brightness and contrast" button in the top menu.
-
Brightness and contrast can be adjusted here.
-
-
-
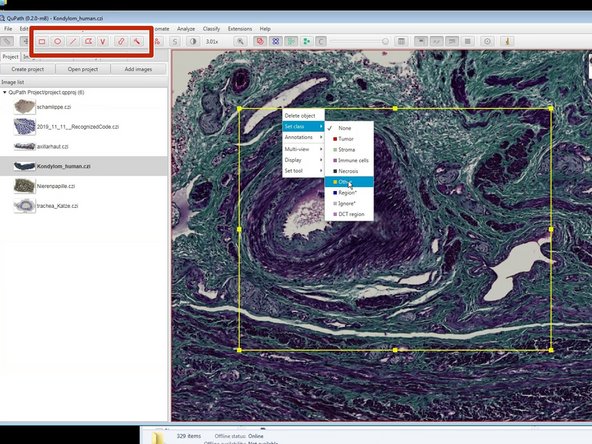
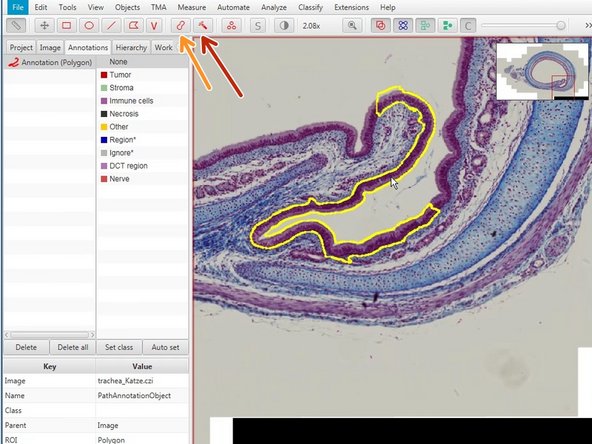
Using the indicated annotation tools you can annotate different regions of interest in your images.
-
Draw a region of interest around the feature you would like to annotate.
-
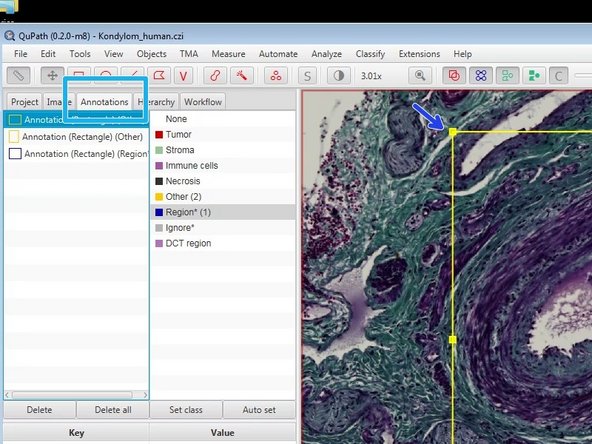
You can resize it by using the handles.
-
and move it by dragging.
-
A selected region can be deleted using the "Del" or "Backspace" keys.
-
Right click on the selected region (it will always be yellow) to set the class.
-
You can navigate through the different regions on the Annotation tab by double clicking on the list, or directly inside the region on the image.
-
-
-
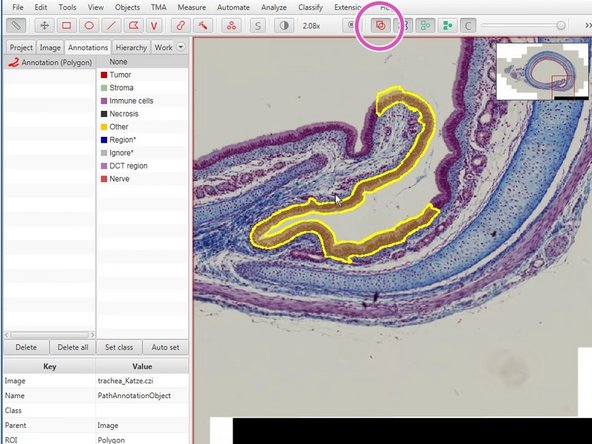
The wand (red) and brush tool (orange) are useful tools to define complex shapes.
-
To redefine areas press "Alt" an drag around the area you would like to erase.
-
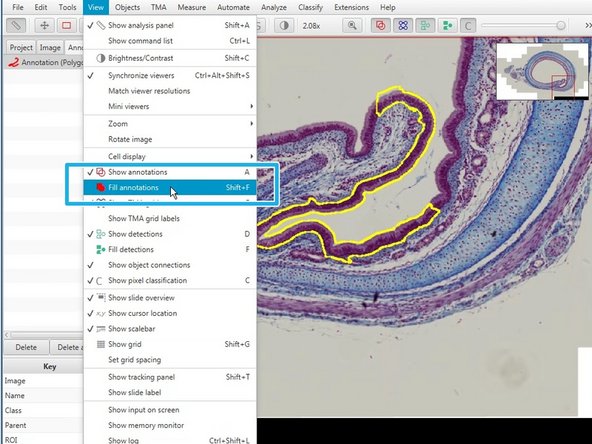
Fillings in annotations will allow you to highlight the selected area (Shift+F).
-
You can press the "Space" bar to alternate between move and wand/brush tools.
-
In the top menu you can toggle on/off annotations.
-
-
-
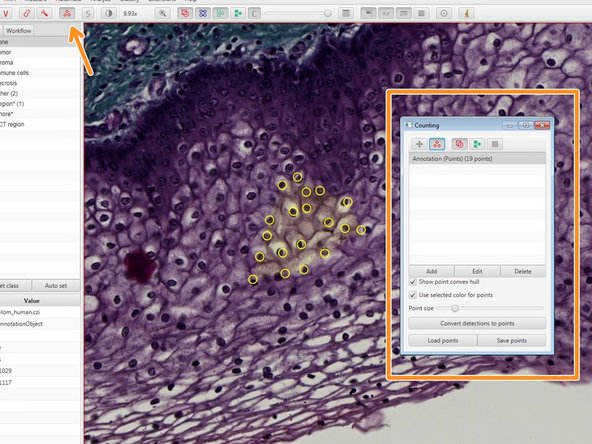
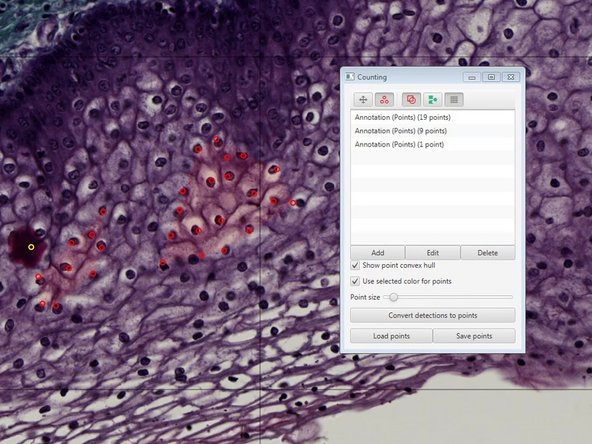
You can use the indicated tool to manually count objects.
-
Existing points can also be removed by pressing "Alt" while clicking on an existing region.
-
-
-
If you want Qupath to automatically detect your cells follow the next steps.
-
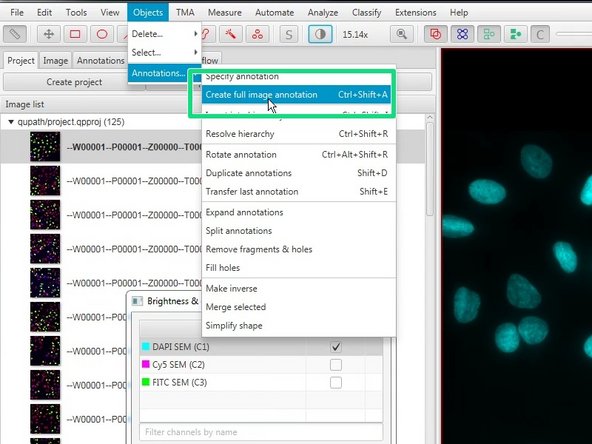
Create or select an annotation around a region where you want to detect cells (ideally quite small, to contain perhaps 100 cells so you can adjust the parameters).
-
You can also select the whole image using Objects ‣ Annotations ‣ Create full image annotation
-
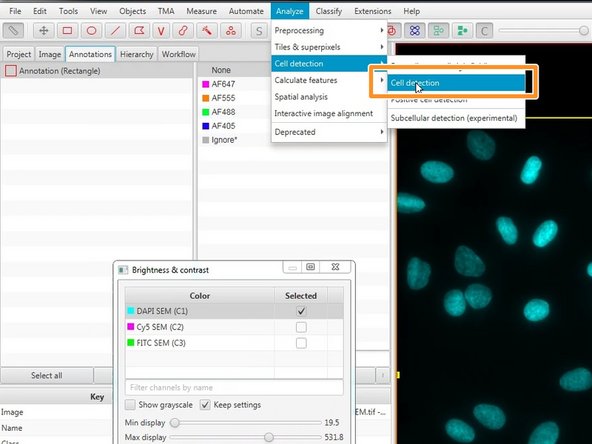
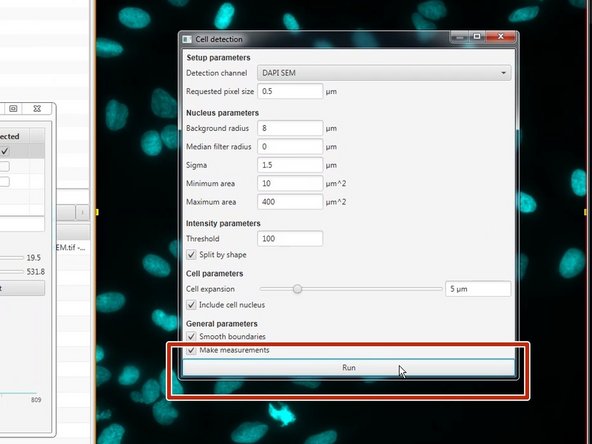
Run the Analyze ‣ Cell analysis ‣ Cell detection command. Initially, you can use the defaults (which tend to behave sensibly across a range of images).
-
-
-
Press the Run button at the bottom of the dialog. After a few seconds, cells should appear in the area you have selected.
-
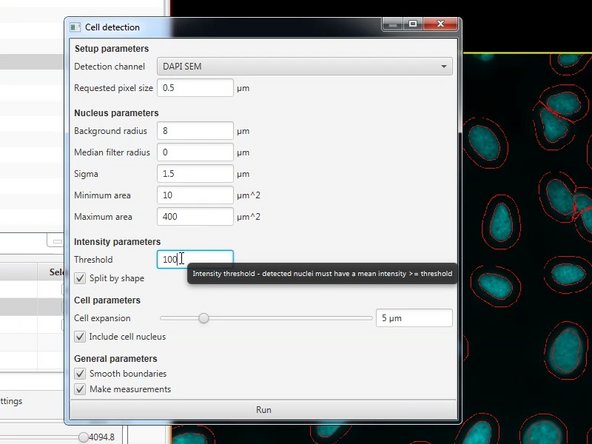
If you are not happy with the detection you can adjust the parameters and re-run the detection. (E.g. change the intensity threshold, cell expansion, etc).
-
If you hoover over a field you can access more info that. This will help you adjust your detection.
-
-
-
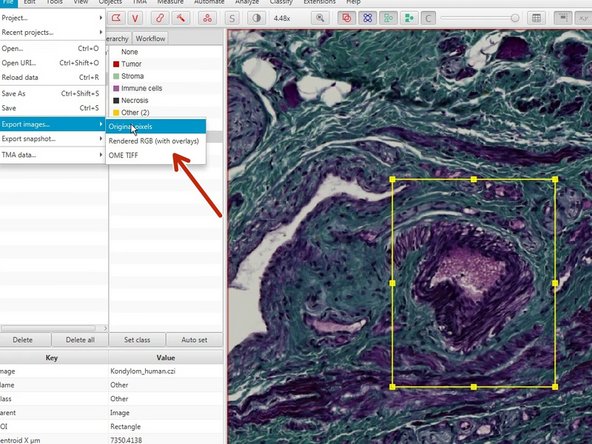
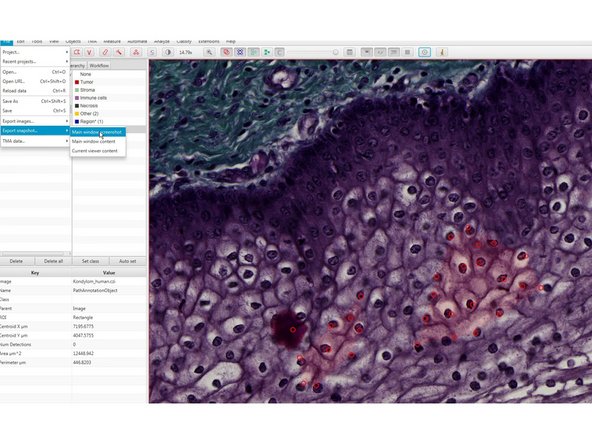
For further image processing and analysis you can export selected regions as images through
-
File<Export images<Original pixels (Recommended).
-
You can also keep the overlays if you choose "Rendered RGB (with overlays)".
-
For a snapshot use
-
File<Export snapshot< Main window screenshot
-
this will export a *.png snapshot of the main window (eg for illustration purposes).
-
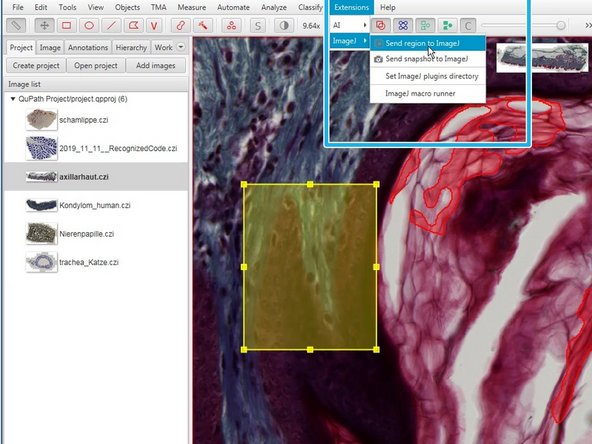
In the menu "Extensions" you can export a selected region to ImageJ for further processing.
-
-
-
More documentation here: https://qupath.readthedocs.io/en/latest/
-
You will also find many valuable tutorials that will help you further analyse your data using QuPath:
-
Measuring areas,
-
Cell classification,
-
Pixel classification,
-
-
Great video tutorial - Introduction to QuPath for Multiplexed Fluorescence Microscopy from BIIF https://www.youtube.com/watch?v=WTAgXpuu...
-