
Introduction
This guide describes the basic steps to acquire EDX spectra using the Oxford system at the Zeiss Gemini 450 SEM at the Center for Microscopy and Image Analysis, University of Zurich.
-
-
Using the SEM software and controls, prepare the microscope for imaging at 12 mm working distance.
-
EDX is controlled by a dedicated computer. Move the mouse cursor to the screen on the right side and log in into that computer using your ZMB credentials
-
Start the AZtec software.
-
Create a new Project. Give a name and select the project location. This should be in your data folder on the ZMB server.
-
-
-
Keep a visual control of the position of the sample to avoid collisions.
-
In the Menu "EDS detector control":
-
Select "Insertion" and "IN".
-
The detector will be inserted.
-
Once the detector is inserted switch the camera off to prevent X-ray background counts.
-
In the SmartSEM acquire an image: it is common to use intermediate (10-20 keV) accelerating voltages to measure X-ray photons at higher energies. This depends on the elements to be detected (see EDX energy tables).
-
-
-
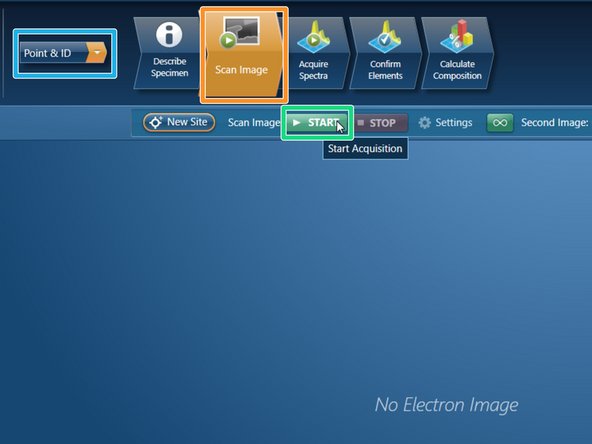
Select the option "Point & ID" (mode that fits most projects, contact our staff for other options).
-
In the menu Scan Image:
-
Press "START" to acquire a SEM image
-
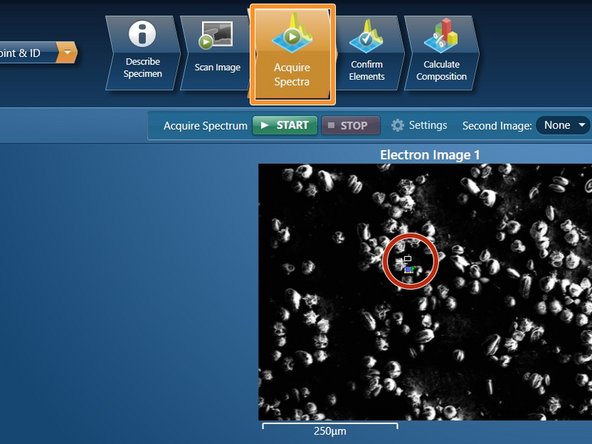
Once the image is acquired. In the acquired Spectra menu:
-
Use the mouse cursor to point to an specific area from where the EDX will be measured and then click on it.
-
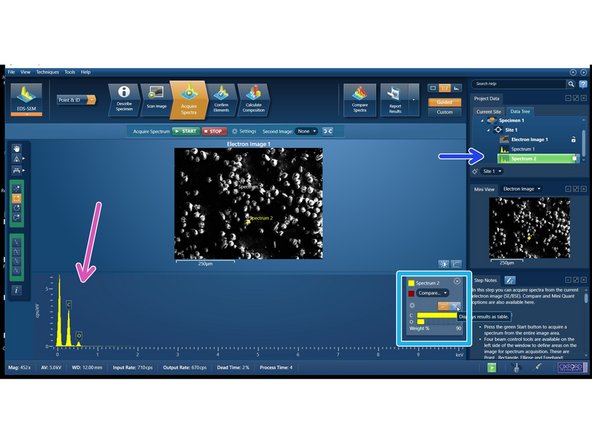
The EDX spectra is recorded. The identified peaks appear in the spectrum.
-
Quantification is displayed as wt% (weight%). The statistical error is displayed as σ (weight% sigma) for the calculated wt%
-
The progress of acquisition is displayed with a green bar.
-
-
-
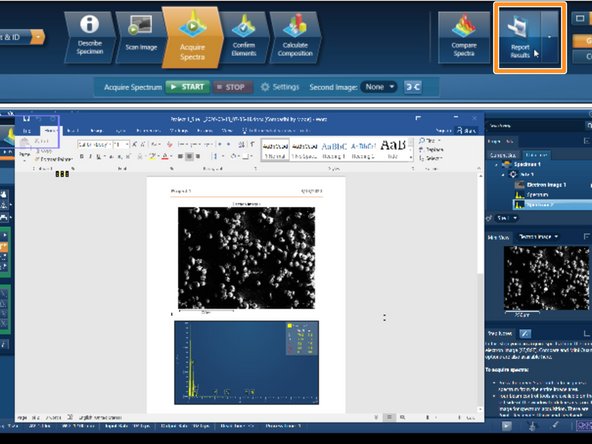
Click on report to obtain a word document with the results.
-
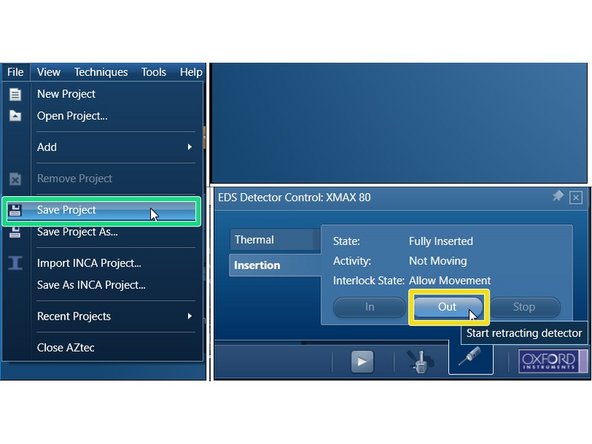
Save Project.
-
In the "Insertion" menu, select "OUT" to retract detector.
-
Quit "AZtec" and log off
-
In SmartSEM, activate the camera.
-
Continue with SEM imaging or close session.
-


Cancel: I did not complete this guide.
2 other people completed this guide.
