Introduction
Bitplane Imaris is a commercial software package for the visualization, segmentation and analysis of multidimensional microscopy datasets.
Besides open source tools such as Fiji, Imaris is the most used software at the ZMB to explore and analyze light microscopy data. The main reasons are the simplicity and the ease of use for visualization of microscopy data, segmentation and quantification in 3D and 4D. Especially for 3D visualization there are as of now no open source tools with a similar performance.
This guide will introduce you to the visualization and segmentation of 3D and 4D microscopy datasets with Bitplane Imaris.
Please also check out the other guides of the Imaris series, especially the guide Imaris Part 1: File Import Using Arena.
This guide was written using Bitplane Imaris 9.3.0.
-
-
Reserve and open a ZMB image processing virtual machine.
-
Open the most recent version of Imaris x64 (9.3.0).
-
Imaris will automatically start in the "Arena" view.
-
If you are not familiar with this feature please refer to Imaris Part1: How to use Arena in Imaris 9.3.0.
-
Double click to open your *.ims file.
-
-
-
To make an intensity based 3D segmentation in the “3D View” go to the “Scene – Properties” pane and click the blue Icon “Add new Surface”.
-
The surface creation wizard starts.
-
Select “Segment only a Region of Interest” and “Process entire Image finally”.
-
This allows you to do your parametrization on sub-volumes and therefore the software is more fluid and responsive. After you set up all parameters correctly, you can process the whole dataset in the end.
-
Click "Next"
-
-
-
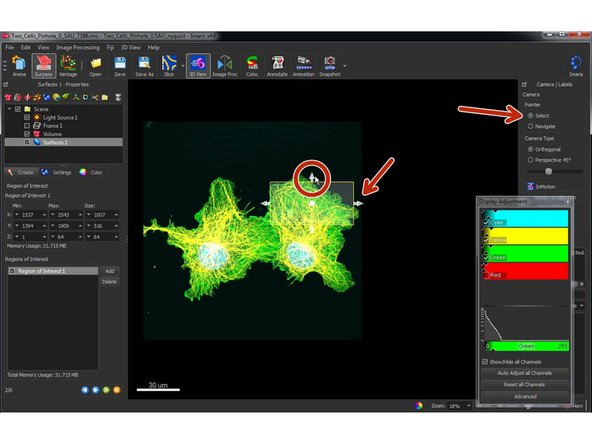
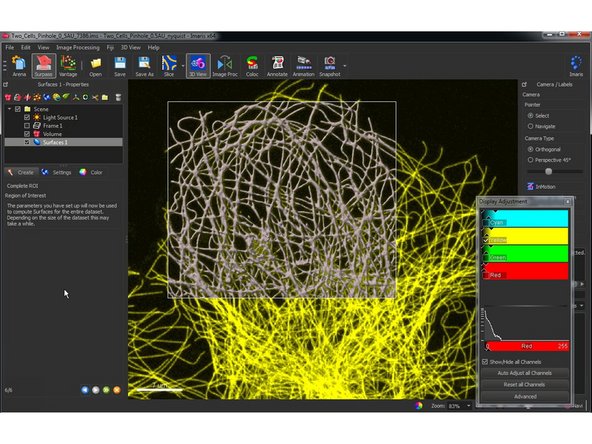
Define your region of interest by changing the dimensions and positions of the transparent box.
-
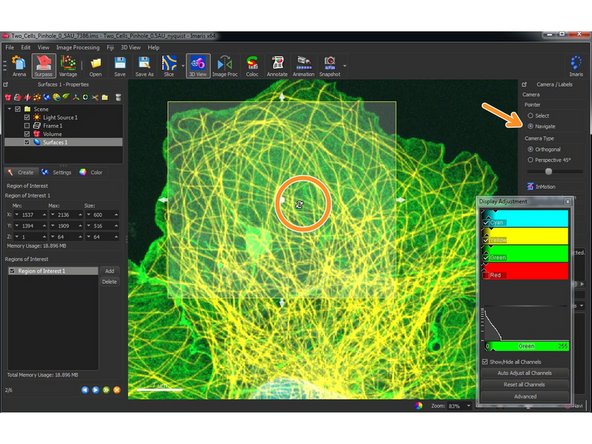
Use “Select” to adjust the size and position of the “Region of Interest” box.
-
Use “Navigate” to adjust the view.
-
Visualize your channel of interest and uncheck the ones you don't need.
-
You can also switch between “Navigate” and “Select” by pressing the Escape button.
-
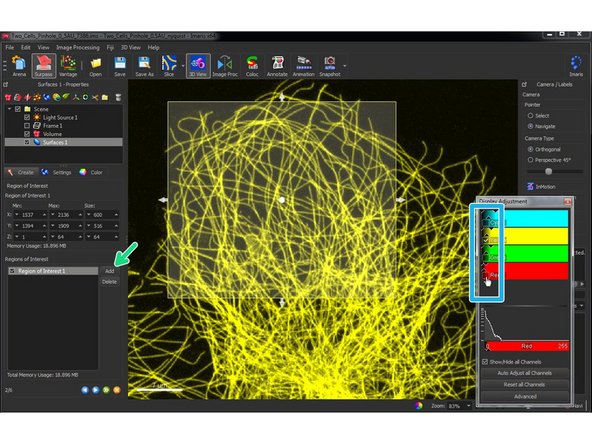
If your image is very heterogeneous you can also place multiple “Regions of Interest” for a better parametrization by pressing “Add”.
-
Press next.
-
-
-
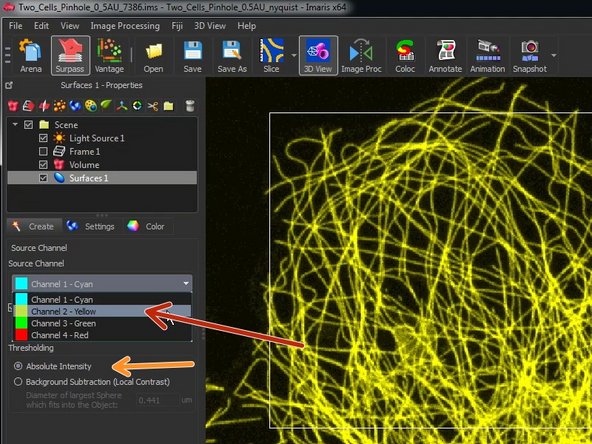
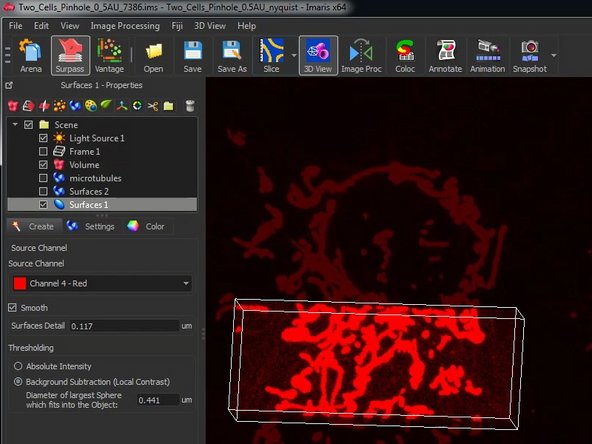
Select the channel you want to segment.
-
Choose if you want to apply a feature smoothing and/or an adaptive thresholding with a local background subtraction.
-
If you are unsure try with the default values and if you are not happy you can always go back.
-
The two images correspond to two different channels, which are given as examples.
-
Since version 9.9 Imaris has the option of using machine leaning pixel classification to create surfaces! For more info check the corresponding guide or https://imaris.oxinst.com/learning/view/...
-
You can find a great tutorial and more tips here.
-
-
-
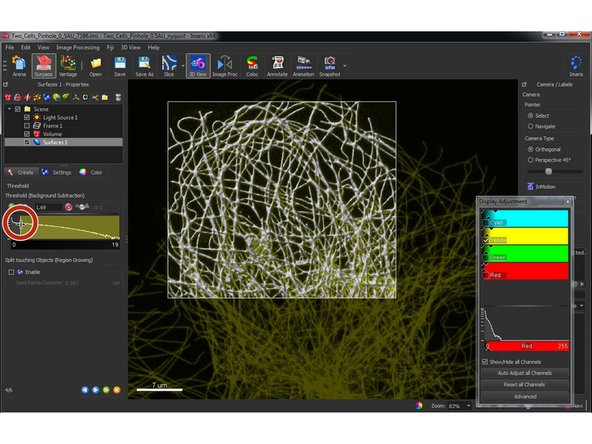
Adjust the intensity threshold for segmentation.
-
It’s usually better to include lower intensities (Lower threshold) as you can work with other filters in the following steps.
-
If you have difficulties to interactively see your segmentation results, you can also toggle off and on the different channels in the “Display Adjustment” window.
-
Also keep in mind that your segmentation and therefore statistical readouts (e.g. volume) very much depend on this threshold value.
-
-
-
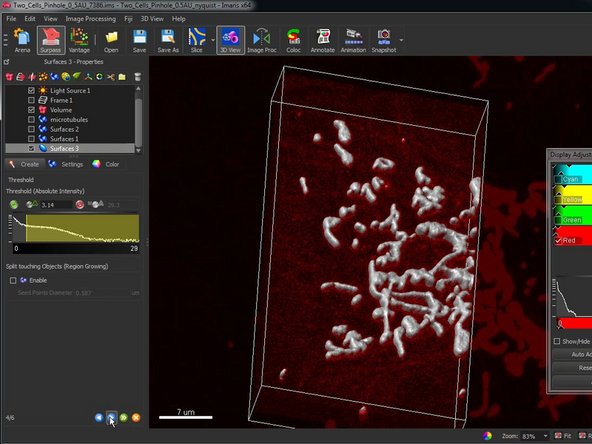
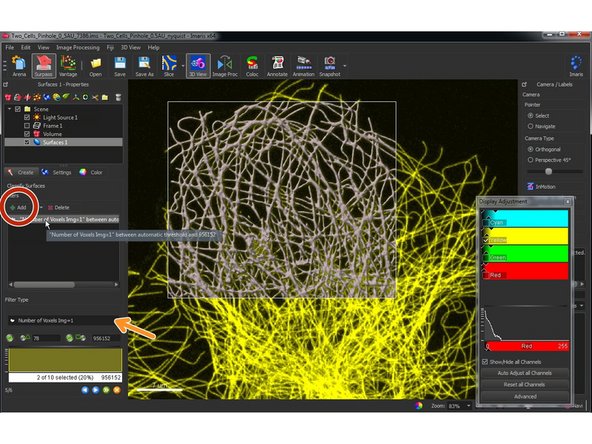
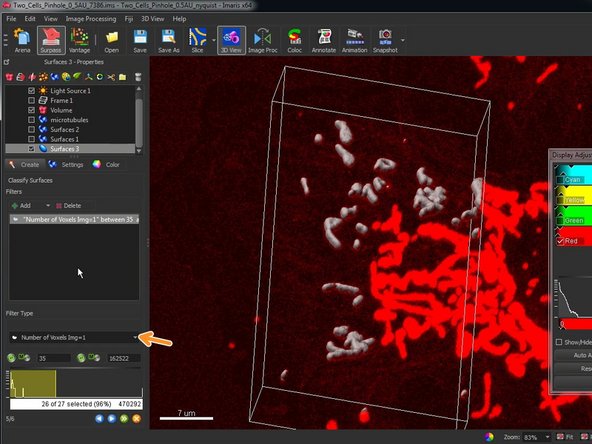
In this step you can classify/filter your surfaces using a combination of filters.
-
E.g. In the second image only dimmer objects were segmented.
-
Add additional filters if necessary.
-
In the drop-down menu you can choose from a selection of filters.
-
As an example, this can be useful to remove small dot like structures, which might not be of interest.
-
This also allows to use the intensity information of other channels: e.g. find structures which have different intensities in two independent channels.
-
-
-
Once you have adjusted all parameters, you can apply the segmentation of your ROI to the whole dataset.
-
This can take some time.
-
If you have a time series, the surface generation will be performed for all time points.
-
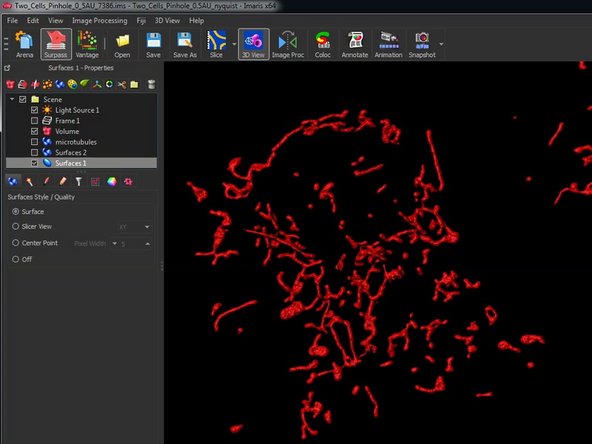
When your segmentation is done, you can adjust the visualization of your surfaces, manually delete objects which are not of interest and explore and export (e.g. to excel or matlab) the statistics for each individual object or globally.
-
-
-
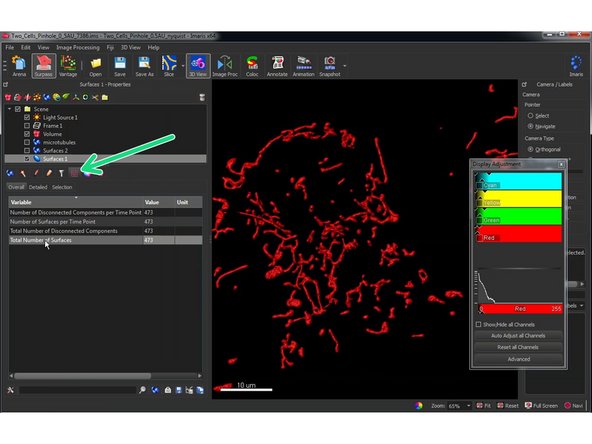
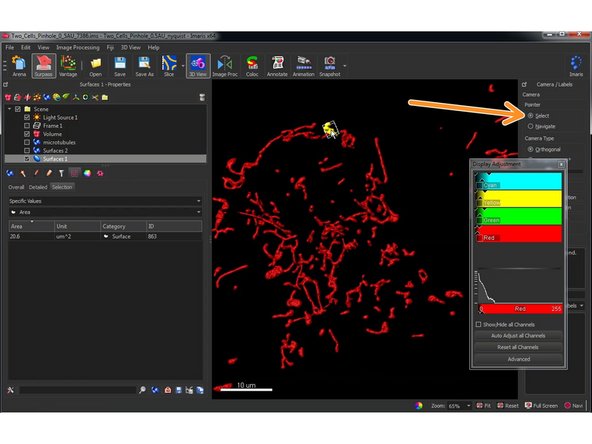
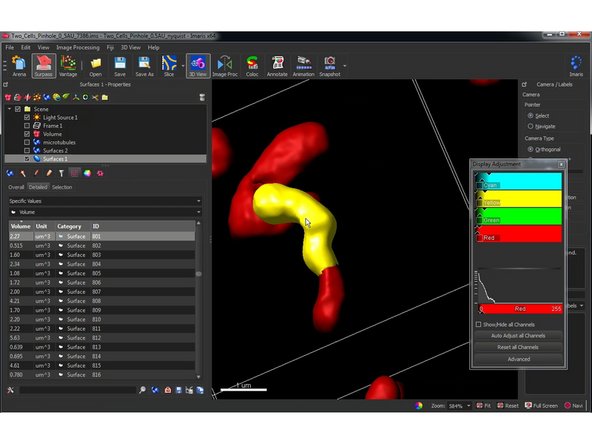
Here you can access the statistics for your surface.
-
You can also select and highlight individual components and show their corresponding statistics.
-
-
-
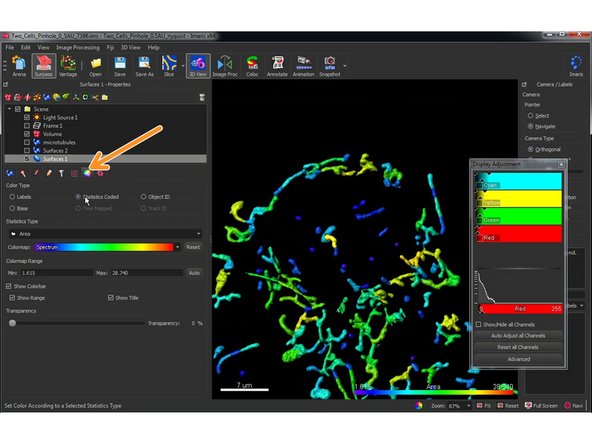
Something very helpful to see patterns and trends in your data is the statistical coding of surface objects.
-
Here you can assign a color according of one of the objects variables such as size or roundness.
-