Introduction
Ilastik is a simple, user-friendly free open source tool for interactive image classification, segmentation and analysis. At the ZMB, we use it as a segmentation and particle tracking solution for projects where classical intensity based thresholding strategies fail.
It is built as a modular software framework, which currently has workflows for automated (supervised) pixel- and object-level classification, automated and semi-automated object tracking, semi-automated segmentation and object counting without detection.
Ilastik learns from labels provided by the user through a convenient interface. Based on these labels, Ilastik infers a problem specific segmentation. A random forest classifier is used in the learning step, in which each pixel’s neighborhood is characterized by a set of generic (nonlinear) features. Ilastik makes use of all dimensions in the feature calculation.
Ilastik was first released in 2011 by scientists at the Heidelberg Collaboratory for Image Processing (HCI), University of Heidelberg.
This guide was written using Ilastik 1.3.2.
Adapted from www.ilastik.org and “Sommer C, Straehle C, Kothe U, Hamprecht FA: Ilastik: Interactive learning and segmentation toolkit. In: Proceedings - International Symposium on Biomedical Imaging, pp 230–233, 2011”.
-
-
Reserve and open a ZMB image processing virtual machine.
-
Open the most recent version of Ilastik.
-
Under “Create New Project” choose “Pixel Classification”.
-
Save your Ilastik project in a folder of your choice.
-
-
-
If the data of interest consists of only one frame or is stored as a .hdf5, select "Add separate image(s)..."
-
In case of an image stack with one file per time step or z-slice, select "Add a single 3D/4D Volume from Sequence..."
-
Choose your files. By holding shift you can select multiple files in a folder.
-
Define the dimensionality by “Stack Across” (T, Z, C).
-
By double clicking on the file in "Raw data", the dataset properties can be reviewed and adjusted.
-
If Ilastik runs slowly, try converting the data into .hdf5. The easiest way to do this is to select “Copied to Project File” for the "Storage" option in the dataset properties window.
-
-
-
The best user experience is achieved when using a mouse +scroll wheel.
-
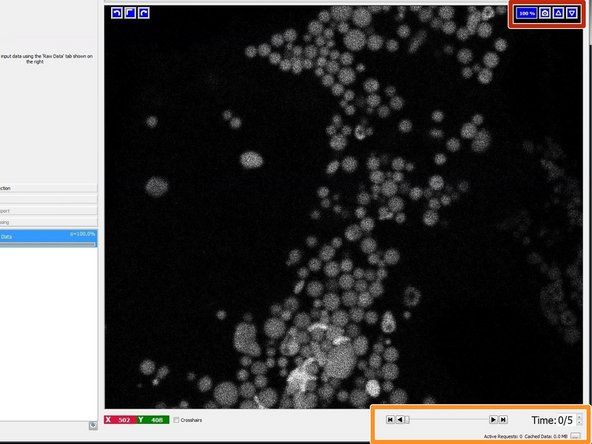
Ilastik will display a 2D+t dataset as a 2D image per time frame.
-
A 3D+t dataset is displayed in a a split view with xy, yz, and xz slicing planes and a 3D window.
-
To zoom in and out of any of the views use Ctrl + mouse wheel scrolling.
-
Hold the mouse wheel pressed and move the mouse for panning.
-
To navigate through time, press Shift + mouse wheel scroll or use the time spin box in the lower right.
-
-
-
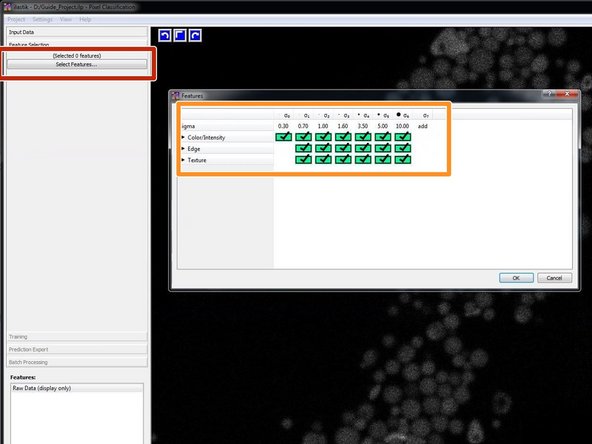
Click on "Select Features..." to select features.
-
As a starting point choose all features at all given scales.
-
Depending on your data and segmentation needs, you might need to consider the “Feature Selection” as a part of your optimization process.
-
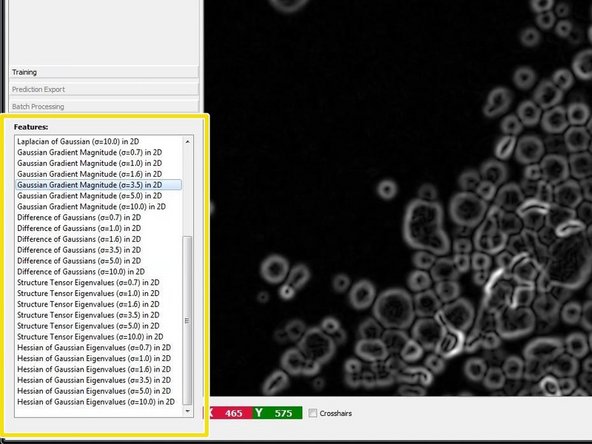
Take a look at the calculated features. Try to remove the ones that look unnecessary but make sure that the prediction remains good (next step). Less features means less computational time.
-
-
-
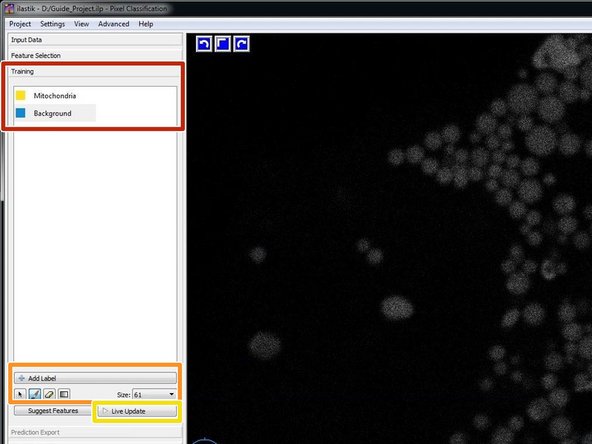
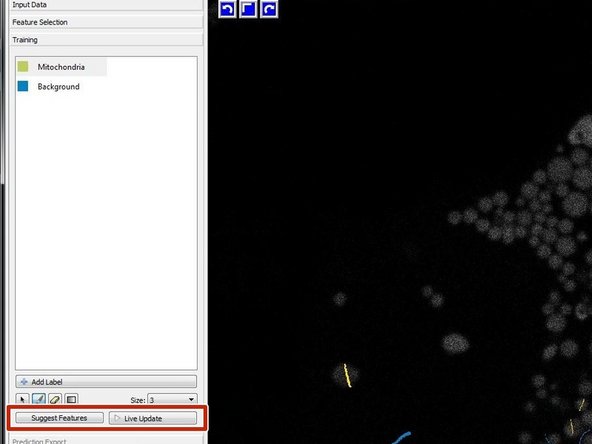
Go to "Training" and rename the labels/classes by clicking on it. If you have a more complex situation, you also might want to introduce additional labels/classes. This might improve your results quite dramatically.
-
Select your first label, chose a suitable brush “Size” and paint on some of your structures of interest. Go to the next class and do the same.
-
If you want to know how the classifier evolves and also dynamically direct the process, you can activate "Live Update".
-
Start with a few general labels such as a thin stroke in the background, and by marking a few pixels of one or two structures of interest. At this point, probably the boundary between objects is not properly preserved. To fix this, choose a very thin background brush, paint a line between two closely neighboring targets, and inspect the results.
-
-
-
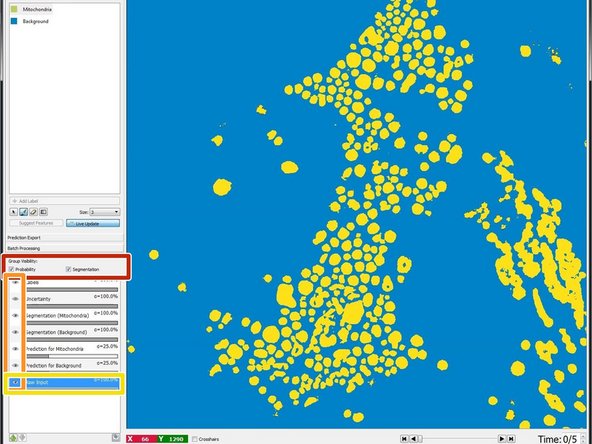
A segmentation with a probability threshold of 0.6 can be viewed by checking "Segmentation" in "Group Visibility".
-
By clicking on the eyes in the lower left pane you can turn off and on the layers for labels, predictions etc.
-
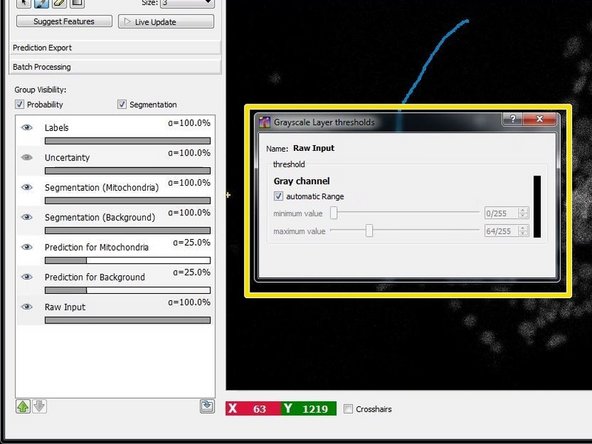
If you have difficulties to see the image intensities during training of the classifier, you can right click on the “Input Data” layer and a new window will open where you can manually adjust the visualization thresholds.
-
-
-
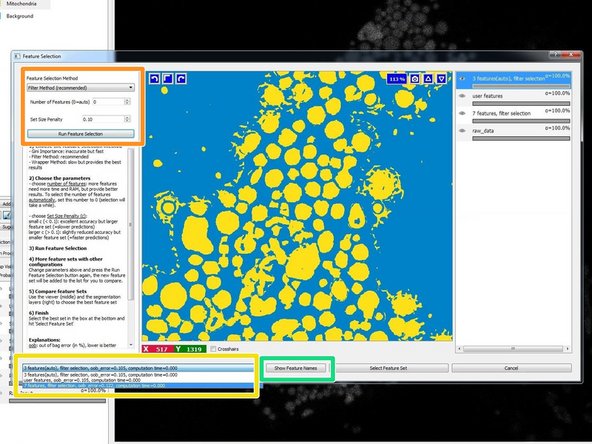
For optional automated feature selection turn off "Live Update" and press "Suggest Features".
-
Run the feature selection with the recommended values.
-
Select the proposed filter sets and check the results. Adjust the parameters as needed.
-
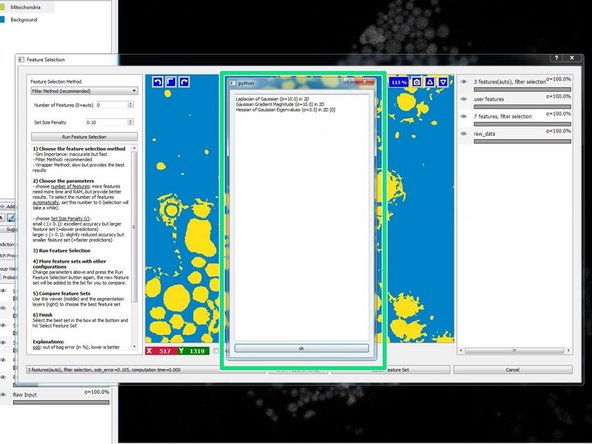
Press "Show Feature Names" to see which features have been selected and to check if they make sense for your classification needs.
-
Select the feature set that works best for you and press "Select Feature Set".
-
Feature selection is not a mandatory step. However in some cases it can improve the results and reduce the computational costs.
-
-
-
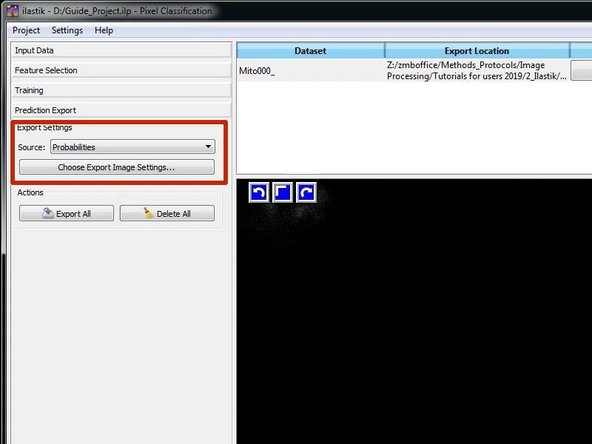
Go to the "Prediction Export" Pane.
-
Usually it is good practice to export the probability images and to threshold and segment them in another tool such as Fiji. Therefore Select "Probabilities".
-
Press "Choose Export Image Settings" to adjust the export settings.
-
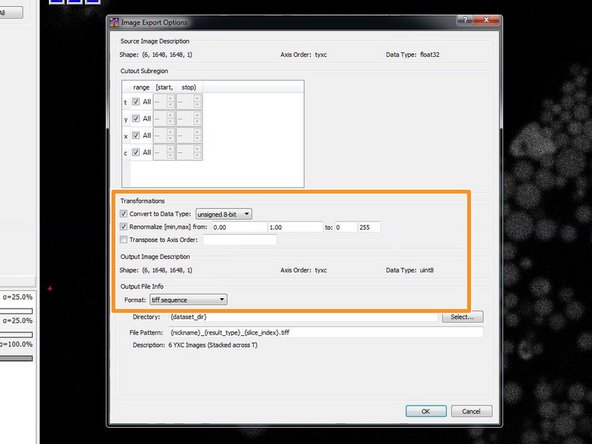
To further process the data in Fiji:
-
Convert to Data Type: “unsigned 8-bit”
-
Renormalize [min, max] from: “0.00” “1.00” to: “0” “255”
-
Format: tiff sequence
-
Close the Export Settings and press "Export All" to start the classification and export process.
-
-
-
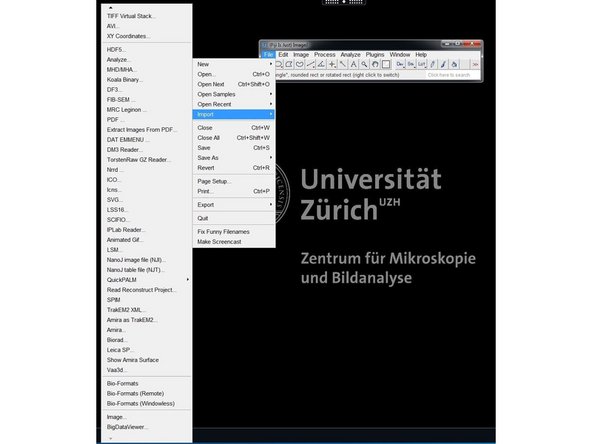
You can open the files in Fiji using Bioformats by File/Import/Bio-Formats.
-
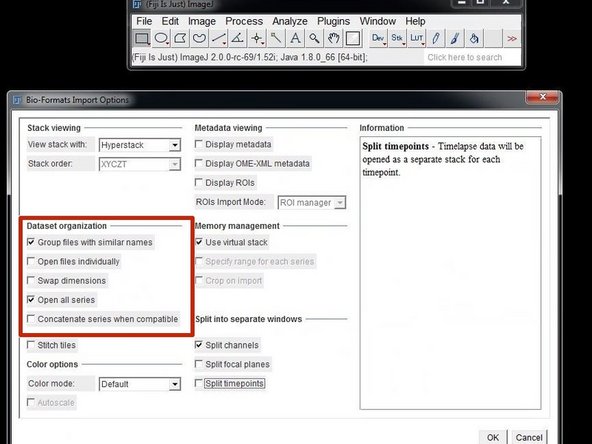
In the Bioformats importer option window select "Group files with similar names" and "Open all Series".
-
Your files will be opened as a hyperstack with the channels representing the different class probabilities for your defined labels/classes.
-
Keep in mind that we choose to rescale the probabilites for the .tif export. This means an intensity value of 127 represents a class probability of 0.5.
-
-
-
Converting image data in Fiji to .hdf5 to classify in Ilastik can save you time and troubles.
-
The Ilastik team developed a Fiji plugin for file conversion as well as for running classification workflows directly from Fiji.
-
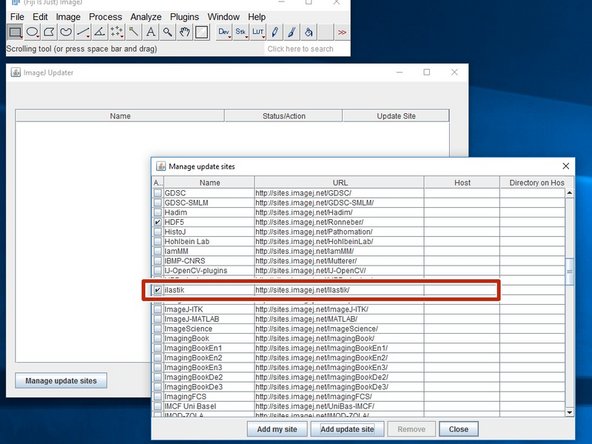
Open Fiji and go to Help/Update and press "Manage update sites".
-
Check the "ilastik" update site, close the list and "Apply changes".
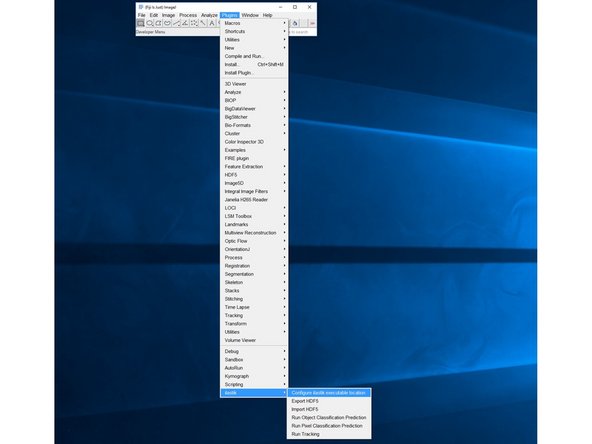
-
After restart you should find and be able to use the ilastik plugin from your "Plugins" menu.
-
On the ZMB virtual machines you don`t have administrator rights. However, you can download your own version of Fiji into your home drive, run it from there and install all the Fiji plugins you need.
-
hdf5 is powerful but also a bit of a mess. This means you need to use the ilastik-plugin conversion and can not rely on other hdf5 conversion tools.
-